Investors Guide to the Federal Election

The next Federal election will be held during May 2019.

It is difficult to remember an election that potentially has so many impacts on investors.  Mark Draper wrote this article for the Australian Financial Review which was published during the month of March 2019.

As if worrying about potential changes to franking credits and capital gains tax discounts weren’t enough, there are a myriad of other potential changes that investors need to think about should Australia have a change of Government at the next Federal election, as is widely anticipated.

Normally politics doesn’t usually need to feature prominently with investment decisions, but we suspect that this Federal election will bring politics to the top of mind for investors.

Here we examine some of the sectors that are likely to be impacted by the election.

Nathan Bell, (senior portfolio manager Intelligent Investor) says “If Labor reduce the CGT discount to 25%, that could drastically reduce demand for investment properties, which has already collapsed due to falling property prices and tighter lending.

This would be very bad news for the banks (and mortgage brokers and other lenders), which need to increase the size of their loan books to grow earnings.”  The banks could also face a higher bank levy from either side of politics as a politically acceptable way of funding election promises, particularly following the Royal Commission.

The ALP has proposed a cap of 2% on private health insurance premium increases. Matt Williams (portfolio manager Airlie Funds Management) is of the view that the insurers are already preparing for the introduction of this policy and that the question investors must ask is whether the health insurers, or the hospitals will have the upper hand in negotiating prices.  Who has the upper hand will determine whether the insurers can operate under this policy without a hit to their bottom line.  He points out that insurers are already looking to reduce claims and keep people out of hospitals with a focus on greater recovery at home and other alternatives. The recent profit result from Medibank Private showed very tight cost control.

Williams is also surprised that neither party as yet has committed to policy to write down the value of the NBN, thereby potentially reducing the price that NBN wholesalers, and by extension consumers, pay for their internet access.  He believes it is likely that the next term of Government write down the value of the NBN.  Such a write down would be broadly positive for the Telco sector as it could lead to higher margins for Telcos, which have struggled to generate a reasonable return from re-selling NBN.  This is unless the price reductions were ‘competed away’ in a highly competitive environment.

Nathan Bell is also concerned about the effects of policy changes to consumer behaviour.  He says “Labor's main policies all act as a tax on consumers. We've already got a recession on a per capita basis, so these policy changes will reduce spending. Non-discretionary retailers, including Woolworths and Coles, recently reported weak earnings growth. These policies could see growth evaporate altogether. People will find ways to cut their spending by buying more discounted groceries; shopping less often; buying more generic brands; and avoiding small treats.  Imagine what that then means for discretionary retailers, such as Harvey Norman and JB HiFi.” 

The Coalitions’ energy policy has ensured that the share prices of Australia’s energy retailers have been heavily discounted on the concerns of electricity prices being capped or companies broken up.  

Bill Shorten late last year also contributed to the uncertainty in energy policy suggesting the ALP will redirect east coast gas, earmarked for export, to the domestic market, if certain price levels (which weren’t disclosed) were reached.  Australia’s gas producers have export contracts to deliver gas that usually spans decades.  Investors are right to be concerned if a Government considered mandating that export contracts be put at risk in order to fulfil domestic demand.  Williams believes that this uncertainty is creating opportunities to buy energy companies that are cheap as a result.

It’s hard to be definitive about how to position investments for the Federal election at this stage, given that both major parties haven’t really put many cards on the table.  What ends up being legislated is often not necessarily what is promised during an election campaign, so investors need to ensure they don’t over react too..  

One thing however is certain, populist politics and business bashing is with us for the moment, and is likely to have material ramifications for investors.  Investors must respond by paying more attention than usual to this years’ Federal election.

Bank Reporting Season scorecoard FY 2018

Article written by Hugh Dive - Atlas Funds Management and reproduced with permission from Hugh

On Monday this week, Westpac ruled off the 2018 financial year profit results for the Australian banks. In the words of Queen Elizabeth, 2018 could only be described as an annus horribilis for Australian banks and their investors. The CEO of one major bank lost his job, the revelations of the Financial Services Royal Commission resulted in remediation provisions and a spike in legal fees (which should see new sports cars and houses at Palm Beach for sections of the legal community this Christmas), fines were levied and credit growth slowed. An environment of fear has weighed on bank share prices.

There are common themes emerging from the banks in the 2018 reporting season. We will differentiate between the major trading banks and hand out our reporting season awards to the financial intermediaries that grease the wheels of Australian capitalism.

Scaling back the empire

The main theme from 2018 was the breaking down of the allfinanz model that the banks built up carefully over the past 30 years. Allfinanz or bancassurance refers to the business model where one financial organisation combines banking, insurance and financial services such as financial planning to provide a financial supermarket for their customers. This is based on the somewhat false assumption that the bank’s employees can efficiently cross-sell different financial products to their existing customers at a lower cost than if this was done by separate financial institutions. It creates some of the conflicts of interest that have been on display at the Royal Commission.

Over the past year, the Commonwealth Bank sold its life insurance business to AIA and the asset management business a week ago to Mitsubishi UFJ for a very solid price. Similarly, ANZ exited both its wealth management and life insurance businesses. NAB also announced plans to sell MLC by 2019. Additionally, Westpac has reduced its stake in BT Investment Management (now renamed as the Pendal Group). These moves acknowledge that creating vertically-integrated financial supermarkets was a mistake. If adverse rulings are made on vertical integration in the Royal Commission’s Final Report, most of the banks will have already made moves to simplify their businesses, so shareholders won’t be exposed to significant ‘fire sales’ of assets by motivated sellers.

Profit growth hit by remediation

Across the sector, profit growth was subdued in 2018 as the banks grappled with slowing credit growth, the application of tighter lending standards, customer remediation and legal costs. The table above looks at the growth in cash earnings inclusive of these costs. Whilst many companies encourage investors to look through these charges, ultimately these are real costs that impact the profits available to shareholders, and in aggregate the four banks have set aside $1.3 billion to cover customer remediation.

Westpac reported the strongest cash earnings by cost control, very low bad debts and a lower level of customer remediation charges. NAB brought up the rear due to both $755 million in restructuring costs and $435 million in customer remediation charges.

Bad debts stay low

A big feature of the 2018 results for the banks has been the ongoing decline in bad debts. Falling bad debts boost bank profitability, as loans are priced assuming that a certain percentage of borrowers will be unable to repay. Additionally, declining bad debt charges year on year creates the impression of profit growth even in a situation where a bank writes the same amount of loans at the same margin. Bad debts fell further in 2018, as some previously stressed or non-performing loans were paid off or returned to making interest payments. The main factors causing this fall has been the low unemployment rate and a near absence of major corporate collapses over the past 12 months.

Westpac and Commonwealth Bank both get the gold stars with very small impairment charges courtesy of their higher weight to housing loans in their loan book. Historically home loans have attracted the lowest level of defaults.

Shareholder returns hold as dividends steady

Across the sector, dividend growth has essentially stopped, with Commonwealth Bank providing the only increase, two cents, over 2017. In an environment where loan growth is slowing, provisions rising and the management teams regularly appearing either in front of the Royal Commission or before our political masters in Canberra, it would be imprudent for the banks to raise dividends.

In 2018, dividends were maintained across the banks, which was a surprise in the case of NAB. It paid $1.98 in dividends on diluted cash earnings per share of only $2.02, a very high payout ratio and not a sustainable situation given that the bank’s capital ratio is below the APRA target of 10.5%.

Looking ahead, dividend growth is likely to be subdued in 2019, as the banks digest the outcome from the Royal Commission. ANZ and Commonwealth Bank shareholders can expect capital returns in the form of share buy-backs to offset the dilution from asset sales. In 2018, ANZ bought back $1.9 billion of its own stock, with an additional $1.1 billion due over the next six months. The major Australian banks in aggregate are currently sitting on a grossed-up yield (including franking credits) of 9.4%, an attractive alternative to term deposits.

Interest margins

The banks’ net interest margins [(Interest Received – Interest Paid) divided by Average Invested Assets] in aggregate declined in 2018, reflecting higher wholesale funding costs and borrowers switching from interest only (which attracts a higher rate) to principal and interest mortgages. This switching was done in response to regulator concerns about an overheated residential property market, and in particular the growth in interest-only loans to property investors. Looking ahead to 2019, margins should recover courtesy of a rate rise of around 0.15% announced in mid-September. All the banks put through a similar rate rise with the exception of NAB, and it will be interesting to see whether NAB increases its market share as a result of this or follows suit at a later date.

Total returns including share prices

All the banks have delivered negative absolute returns, also trailing the S&P/ASX200 which eked out a small gain of 0.24%. The uncertainty around the outcomes from the Royal Commission, rising compliance costs and slowing credit growth has weighed on their share prices. Westpac has been the worst-performing bank, mainly due to concerns about lending standards in the $400 billion mortgage book, though we are yet to see any adverse evidence in the form of rising bad debts.

– No star given –

Our overall view of the future

It is hard to be a bank investor at the moment and some fund managers are advocating avoiding them all together.

We view that at current prices, investors are being paid an attractive dividend yield to own solid businesses that have a long history of finding ways to grow earnings and navigate political minefields. Looking at the wider Australian market, the banks look relatively cheap, are well capitalised and unlike other income stocks such as Telstra, should have little difficulty maintaining their high fully-franked dividends. Additionally, the share prices of ANZ and Commonwealth Bank will see the benefit of share buy-backs, as the proceeds from the sales of non-core assets are received. The key bank overweight positions in the Maxim Atlas Core Equity Portfolio are Westpac, ANZ and Macquarie Bank.

Hugh Dive is Chief Investment Officer of Atlas Funds Management. This article is for general information only and does not consider the circumstances of any investor

Just how far will property prices fall

Written by Roger Montgomery (CEO Montgomery Investments)

For the last two years, we were feeling rather lonely suggesting that the property boom would end abruptly. Today, property prices are falling, and we are no longer a lone voice. The question is: how much further will they fall?

A number of changes are contributing to the declines in property prices.

For a start, rising bank fund costs are leading to higher mortgage rates. Then there’s a tighter definition of responsible lending following the Royal Commission – which will mean fewer individuals qualifying for a loan to buy property, and those that do get a loan will receive less. And on top of that, there’s been the introduction of lower debt-to-income limits and a wave of borrowers being migrated from interest-only loans – which hit a peak of $159 billion in 2015 – to principal and interest.

These structural changes will continue to impact property prices for some time.

One indication that prices might fall further than the 10 to 15 per cent suggested by some of my fund manager friends, is recent research produced by UBS that suggests the sanguine attitude held by borrowers towards their loans is misplaced. The research reveals a widespread lack of knowledge exists among borrowers about the terms of their interest-only loans and the extent of the increase in repayments that will need to be made when they are moved onto principal and interest.

UBS has uncovered some startling facts. When asked why borrowers took out an interest only mortgage, 18 per cent responded they “can’t afford to pay P&I”, 11 per cent said they expected house prices to rise and to sell the property before the interest only period expires and 44 per cent noted it gave them more financial flexibility. One can safely assume some proportion of the 44 per cent were also in the can’t afford P&I camp.

When combined, there are a substantial number of borrowers who have taken out an interest-only loan for the wrong reasons.

Moreover, many of these borrowers don’t understand the product they have been sold. Among owner-occupiers only 48 per cent understand their interest-only term expires within five years, which is the maximum term typically offered. Meanwhile 18 per cent observed they don’t know when their term expires and 8 per cent believe their interest-only term will last more than 15 years. A 15-year interest-only loan doesn’t exist.

The serious problem, however, is not that many borrowers will be shocked by how quickly their life will change, it is how much it will change.

34 per cent of all interest-only borrowers stated they “don’t know” how much repayments will rise. Meanwhile, 53 per cent expect repayments to rise up to 30 per cent and only 13 per cent of respondents indicated they expect their mortgage repayments to rise more than 30 per cent. Repayments will rise by at least 30 per cent and that is without interest rate rises in the interim.

UBS have gone a step further and calculated the step up for investors and owner-occupiers with a $600,000 interest only mortgage moving over to P&I. Depending on the duration of the principal and interest mortgage, the step up can be as much as 91 per cent! In other words for some borrowers repayments could double. Clearly, the majority of this cohort are unprepared or underprepared for the inevitable increases.

But why are we concerned? And why are all these people being forced onto principal and interest loans? The answer is APRA, in response to the Financial System Inquiry some four years ago. APRA imposed on the banks a strict limit of 30 per cent of all new mortgages written that can be interest-only. In 2014 and 2015 up to 49 per cent of mortgages written were written on interest-only terms but when these loan vintages mature in 2019 and 2020, only 30 per cent, including any brand new mortgages written, will be permitted to be on interest-only terms.

Of course the banks are fully aware of this situation and they understand that because it is the marginal seller of property – this weekend’s vendor – that will determine property prices for everyone, they must try to move as many people onto principal and interest that can afford it. That way those who can least afford the step-ups will be extended another interest-only loan for a further five years.

No wonder some of my friends who have mortgages – some have used them to fund purchases of real estate in Japan’s ski resorts – are already being asked to move over to P&I. By doing so it reduces the pressure on the banks to force people across who can least afford it.

Inevitably of course this creates an overhang of property that acts like a ceiling on prices at least until the next wave of buying breaks through it.

Until then expect even lower returns from residential property than those returns that were already locked in by paying a very high price.

Roger is the Founder and Chief Investment Officer of Montgomery Investment Management. Roger brings more than two decades of investment and financial market experience, knowledge and relationships to bear in his role as Chief Investment Officer. Prior to establishing Montgomery, Roger held positions at Ord Minnett Jardine Fleming, BT (Australia) Limited and Merrill Lynch.

No mysteries behind rising power prices

Over the past few months, rising energy prices have dominated newspaper headlines, treating readers to the sight of politicians wringing their hands, promising to get to the bottom of this issue and find out who is responsible. Large power generators, energy retailers and transmission companies are accused of being behind the rising cost of lighting, heating and cooling our nation’s homes.

Whilst the profits that companies such as AGL Energy, Spark Infrastructure and to a lesser extent Origin Energy have increased over the past decade, we see that a significant proportion of the increase can be attributed to energy decisions made by various governments. As an economist, these price increases were predictable based on changes in the supply and demand curves of energy in Australia. There is scant evidence that they are the result of a long-term insidious plan by energy companies to capture a greater share of the nation ’s pay packets.  In this week’s piece, we are going to look at energy prices impacting Australia’s consumers and industrial users alike.

Energy prices this century  


The above chart shows household gas and electricity prices in Australia and compares them to inflation. Using June 2000 as the baseline year, the CPI [Consumer price index which measures the prices paid by consumers for a basket of goods and services including energy] has risen by 61%. Over this same period, electricity has risen by +226% and natural gas by +207%.  As you will note from the above chart, energy price rises roughly matched inflation up until 2008, however energy prices have accelerated in relation to CPI particularly since 2012. It is worth noting that electricity prices are influenced by natural gas prices in that gas is used in gas-fired power peaker plants that can be fired up in response to peak periods of electricity demand.
 

 Gas Prices Up – a new source of demand


Due to the size of the Australian continent and the absence of pipelines linking the major fields off the coast of WA with Eastern Australia, gas prices are greatly influenced by geography. As you can observe from the below table, due to the lack of physical infrastructure WA’s gas from the giant offshore LNG fields is sold to consumers in Seoul and Tokyo rather than Sydney and Melbourne.


Until the construction of the construction of three liquefied natural gas (LNG where natural gas is cooled to -161 C to allow transportation) in the last five years, producers of natural gas on the East Coast of Australia could only sell their gas into the East Coast domestic market. This resulted in gas being priced below world prices for East Coast consumers. For example, in 2008 the wholesale price of 1 gigajoule of natural gas was $15 in WA versus $5 in NSW. The opening of these three export LNG plants in Gladstone in Queensland by Origin Energy, Santosand BG in 2015 and 2015 allowed the export of natural gas from  Eastern Australia to Northern Asian customers that were willing to pay over $10 per gigajoule.

Additionally, unlike in WA which mandates that 15% of gas produced in the state is reserved for domestic consumers, no such gas reservation scheme was enacted on the East Coast of Australia. AGL’s plan to construct an LNG import terminal by 2020 to serve the Victorian gas market will further link the prices that Australian consumers pay for natural gas to the world market, with gas expected to be imported from the USA and Qatar.

Consequently, with a new source of demand for natural gas being introduced and East Coast gas markets opened up to world prices, domestic prices naturally gravitated towards the higher export price. The construction of these three LNG export terminals has not only had negative consequences for consumers but due to the elevated construction costs of around $71 billion have also been a burden for shareholders with returns below expectations.
 

Gas Prices Up – new sources of supply halted


At the same time that demand for natural gas was increasing, a range of decisions were made by governments in NSW and Victoria to restrict new supply. Arguing about the benefits and harms of coal seam gas is beyond the scope of this piece, but economics dictates that if demand is going up and supply is unchanged, prices will naturally rise. In 2012 Victoria imposed a moratorium on coal seam gas exploration and in 2015 the NSW government banned new gas exploration. This saw AGL announce that it would not proceed with their projects in NSW and that they would be relinquishing their exploration licences. This action contributed to the energy company recording an impairment charge of $640 million in 2016.  We note that in April 2018 the Northern Territory reversed its ban on gas exploration outside towns and conservation areas in a move designed to put downward pressure on power bills.

Generation Costs Up – changing the mix and reducing supply


In the electricity market prices have been driven higher by the Federal Government’s Renewable Energy Target. This will require electricity retailers to acquire a fixed proportion of their electricity from renewable sources and is likely to result in  33,000 GWh of Australia's electricity coming from renewable sources by 2020. Politicians seem surprised that regulations have added to electricity costs, following the closure of coal-fired base-load power stations in favour of more expensive renewables. For example, in 2017 Energie closed the Hazelwood power station that had previously supplied up to a quarter of Victoria’s electricity and AGL have announced that they will be closing the 1,680-megawatt Liddell coal-fired plant in 2022. Whilst we recognise that burning coal to generate electricity releases carbon into the atmosphere contributing to global warming, it is also a very cheap and consistent method of generating electricity. Additionally, coal-fired power plants are well-placed to provide a base-load of consistent generation, as these plans can generate electricity continuously, without requiring the wind to blow or the sun to shine.

Until the battery storage technology catches up to allow generators to store significant amounts of electricity, relying on solar and wind power generation requires natural gas-fired generation to step in to maintain consistent supply. As discussed above, this source of electricity generation is more expensive today that it was 10 years ago. Switching power generation to renewables – whilst socially desirable – comes at a cost, and this is reflected in higher energy bills. Further, in any market when supply is removed and demand remains relatively constant, prices tend to rise. This effect has proven profitable for incumbents who have generators, such as AGL Energy.

Our take

Rising energy costs have impacted consumers and industrial users alike, but they have not arisen in a policy vacuum nor as part of a conspiracy. We see that they are the logical outcome of decisions that have changed the supply and demand for energy and that various companies have predicably acted to generate profit from these shifts. In the Atlas equity portfolio, we own positions in AGL Energy and Spark Infrastructure, both of which have benefited from changes in the energy markets in Australia over the past ten years. Neither of these companies are involved in the LNG export terminals that at this stage look to be a poor investment for shareholders.

Hugh Dive CFA - Atlas Funds Management

Housing Credit Crunch

Livewire recently produced a video with Dan Moore (Investors Mutual) discussing the changes to Australian lending and the likely impact on the economy.

Transcript of video

Q. Are tighter lending standards having an impact and where is it being felt? 

Daniel Moore: We're definitely seeing the banks change their lending standards, particularly around loan to income ratios, which has been pulled back quite a bit. They're now sort of having a max of about six times income, which is reduction in the past. And that's having an impact on loan approvals and clearance rates of the market. 

Q. Self-managed super funds have been pulled back from some of their lending. Westpac initially, some of the other banks, is this another part of that puzzle and is it getting worse?

Hamish: We actually are more focused on investor lending. The investors in Sydney and Melbourne were taking anywhere between 50 and 60% of total mortgage flow at the peak about a year ago, which by international standards is just a witheringly high number. There's no international precedent for numbers anywhere near that high. So, it's true that the banks are pulling back from lending to self-managed super funds for real estate. At Watermark, we're much more focused on the impact of investors pulling back. The work that we've done suggests that borrowing capacity of investors is down anywhere between 10 and 20% and we think it's going to keep going. We know from channel checks with mortgage brokers that not all of the banks have rolled out the new loan serviceability requirements, they will do throughout the rest of the year. 

So the tightening should continue to go in our view. 

Q. So a negative for the economy or is there something positive we can say about it? 

Hamish: No not really. I guess long-term it rebalances the economy and millennials can afford a house. If you're a millennial that's probably a positive. So, lower house prices impacts the economy in a bunch of different ways. Directly it's through something called residential investment. Residential investment is building of new houses, renovating existing houses, and dwelling transfers. And there's a lot of literature that says when that peaks as a contribution to GDP as it has done in Australia about 12 months ago, that's a very good leading indicator for an economic slowdown and usually a recession. 

So there's not a lot of good news about the housing market and residential investment rolling over. 

Q. Daniel, housing affordability getting better certainly helps and makes the economic story a bit more sustainable, is that a positive or is there absolutely none as Hamish is suggesting?

Daniel: I think the one positive you can say is that the royal commission happened before the crisis rather than after. Improving lending standards is a good thing, but there's no doubt the short-term impacts are negative. There's a very close correlation between house prices and household gearing level. So as banks are less willing to lend consequentially you would expect house prices to fall. 

Improving lending standards is a good thing, but there's no doubt the short-term impacts are negative.

Q. If we're looking at the ASX listed stocks who is going to be most affected by this, and what should we be aware of there? 

Daniel: So if you look at probably the leading ... so the companies that are right at the pointing end, so the companies that are leveraged to house prices, or new housing. We sort of look at the property developers, we look at building material companies, and probably the retail sectors which sell household goods particularly the most expensive household goods. 

Q. So into that discretionary side, what are the areas that are really flashing red lights for you?

Hamish: I wouldn't disagree with anything that was said before. Most of the work that we've done that informs our view on Australian housing and its impact on the economy was based on what happened in the Netherlands and the UK earlier in the decade. And exactly as described, the mortgage banks actually do reasonably well, it's the rest of the economy that disintegrates. So, retailers go bust, commercial real estate collapses, people stop going to the movies, people stop going to restaurants, but they pay their mortgages. So, we're focused on many of the same areas. 

The mortgage banks actually do reasonably well, it's the rest of the economy that disintegrates.

Q. What would you do portfolio wise? Are there things you'd sell if this thing was going to take hold?

Hamish: Again, what you would sell is reasonably obvious. I think the one area that might be a little counter consensual is owning the housing banks. So again, when we looked overseas in the Dutch downturn houses prices fell about 20%, the banks lost four basis points on their mortgage portfolios, which is not a lot. That same number in the UK was six basis points, which is not a lot. And in Sweden it was about one basis point.

To answer your question in an interesting way, a counter consensual view that we have is that the housing banks actually will do reasonably well in this scenario, and then the businesses that will do badly are the ones that we described before. 

Q. Daniel you mentioned some of the housing stocks, building materials, any of those particularly a sell for you at the moment?

Daniel: I think if we think of the building materials companies, the one that's most exposed to residential housing in Australia is CSR Limited (ASX: CSR), so despite the multiple looking quite reasonable we think those earnings are at the top of the cycle.

In terms of retail probably the stock that's right at the pointing end, which has had a really good run in terms of earnings growth is Nick Scali (ASX: NCK), they're a furniture retailer. So they're probably two stocks we think are right at the pointy end. 

So they've had a good run and now it's time that things are changing. Not all investments are as safe as houses.

8 charts on our growing tax problem - what abandoning tax reform means for taxpayers

Written by Rebecca Cassells and Alan Duncan (sourced from The Conversation)

As we move closer to Treasurer Scott Morrison’s third budget, what we do know is this - Australia has a revenue problem. A more global and digital economy; an ageing population with fewer taxpayers and sluggish wage growth make future predictions of revenue even more precarious. There’s never been a better time for tax reform. 

But as governments have tried to reform (and stumbled) over the years the burden has shifted to individual taxpayers and the latest budget is likely to be no different.


Read more: Government spending explained in 10 charts; from Howard to Turnbull


We looked at revenue data over the last 20 years drawing from budget papers, government finance statistics and the Australian Tax Office. To compare revenue over time, we have adjusted for the effect of inflation by using real measures.

Tax revenues have risen 26% in Australia since the global financial crisis, from A$310.3 billion in 2009 to A$389.8 billion by 2016. 

Income tax has contributed most to this growth and some is driven by rising wages and jobs growth. Between 2009-10 and 2016-17, individual income tax revenue grew by 37% - an average of 5% each year.


But bracket creep also comes into play as personal tax thresholds have not kept pace with inflation, causing average tax rates to rise among middle income earners in particular. 

The growth in business tax revenue leading up to the global financial crisis was heroic – averaging 11% each year and well above any budget forecasts. In the ten years to 2007, business tax revenue grew by almost 130% - from A$41.4 billion to almost A$95 billion. 


But what goes up must come down, and business tax fell by 6.3% between 2008 and 2016. However we can see strong growth between the last two periods, with business tax receipts growing by 10.7% from A$72.6 billion to A$80.3 billion. 

Revenues from GST and sales taxes have risen, by 16% since 2009.


The relationship between Australia’s economic output and its tax revenue looks somewhat different. The tax-to-GDP ratio reached nearly 25% prior to the global financial crisis, but dropped to 20.5% in 2010-11. It recovered to around 22% by 2012 and has remained essentially flat since then. 


A history of reform attempts

Successive governments have attempted to create an efficient tax system that’s fair and reliable with few distortions. Prior to the turn of the century the Howard government argued the tax system was out of date, complex and inequitable, heavily reliant on individual and company tax, and prevented Australia competing on a global level. 

The Howard government’s new tax system in 2001 was an answer to this. This new tax system seemed to have all the reform solutions needed - income tax cuts for hard working Australians and at long last the introduction of a goods and services tax, along with some pretty big welfare reforms. 

Everything appeared to be going quite well with the new tax system – revenue from company tax was way, way above any Treasury official’s forecast. 

But fast-forward 10 years and cracks began to show, prompting a new review into the effectiveness of Australia’s tax system. The Henry Review, provided some 138 recommendations for tax reform, yet very few saw the light of day. And just five years later, another review was conductedwith then Treasurer Joe Hockey at the helm, which since seems to have been not so much parked as abandoned. 


Income taxes from individuals have always made up the greatest share of tax revenue in Australia. Prior to the introduction of the Howard government’s tax system, income tax from individuals made up 57.3% of the total tax pool – it now accounts for 51.0% of total tax revenue. 

The Howard reforms included a reduction in personal income tax rates. During the next ten years Australian businesses shouldered a greater share of the tax burden, with their share rising from 17.9% in 2000-01 to 27.4% in 2007-08 at the peak of the resource boom. This has since fallen to 20.6%. 

The contribution of taxes on goods and services has remained fairly steady since moving from sales tax to the GST in 2001. GST revenue is consistently around 16% of all tax revenue. 


The share of tax revenue from customs duties, excises and levies has been falling since 2001, from 14.5% to 9.5%. Other tax revenue has been fairly consistent over time, contributing less than 2% of total tax revenue. However, in 2012-13 this increased to around 4%, with the introduction of the short-lived carbon pricing mechanism. 

The problem with predicting future revenue

Taxation revenues were consistently underestimated prior to the global financial crisis, but have fallen below expectations since its end. The tax-to-GDP ratio has been anchored close to 22% since 2012-13. This is despite eight successive federal budgets since May 2010 projecting future tax revenues in excess of 24% of GDP. 

And where does the greatest divergence lie between forecast revenues and out turns?

Company tax revenues are consistently – and by some margin – the most difficult to predict. Receipts fell short of forecast estimates of around 5% of GDP, by around one percentage point over four years, since the May 2010 budget. 

Estimates of company tax receipts for 2017-18 were revised upwards by A$4.4 billion in the latest MYEFO update in December 2017. Should this eventuate, it will take total company tax revenues for 2017-18 to A$83.8 billion (around 4.6% of GDP). 

The government may well feel that this creates space for a company tax cut and personal income tax cuts in the upcoming budget. 


Revenue from individual income tax has been projected to rise to around 12.5% of GDP over the forward estimates, in each budget, since May 2013. Revenue has risen from 9.5% of GDP in 2009 to 11.4% by 2016 before dropping marginally by 0.2 percentage points in the latest Mid-Year Economic and Fiscal Outlook (MYEFO) forecasts.

But wages have not played the leading role that they have been cast in, in every budget going back to May 2011. Since this time wage growth has been forecast at an elusive 3% mark or thereabouts, yet has fallen well short of this each year and currently stand at 2.1%. 


Tax thresholds remained fixed between the 2012 and 2016 budgets, and the only change since has been to lift the 32.5% tax threshold from $80,000 to $87,000, effective 1 July 2016. Tax revenue growth up to now has certainly been driven by the effects of bracket creep. 

Unless tax thresholds in the future are increased at least in line with inflation, this means that average taxes will continue to rise.

Plans for a 0.5% increase in the Medicare Levy rate from July 2019 have been shelved, which would have raised around A$8.2 billion over the next four years to support the National Disability Insurance Scheme.

Expectations have been raised for tax cuts to businesses as the government advocates for the “trickle-down” benefits to Australian households. 

It’s hard to see how this will lead to anything other than a shift in the tax burden towards individual taxpayers – at least in the short term. This is unless company tax cuts are balanced with substantial, not modest, cuts to personal income taxes as well. 

It seems Scott Morrison will be banking ever more on a strengthening economy to support Australia’s taxation revenues into the future.

SA Bank Levy might be legal, but politically unviable

Joe McIntyre, University of South Australia

South Australia’s new bank levy, projected to earn A$370 million over four years, seems to be constitutionally valid but it remains hostage to political machinations.

While precise details are sparse, the Major Banks Levy will target those institutions liable for the Commonwealth bank levy (Commonwealth Bank, ANZ Bank, Westpac, National Australia Bank and Macquarie Bank). It will impose a state levy of 0.015% per quarter of South Australia’s share (about 6%) of the total value of bank liabilities subject to the federal government levy.

By making Commonwealth grant payments conditional on the removal of a levy, the federal government could force South Australia to abandon its bank levy.

It’s here that South Australia can benefit from the cover provided by the federal government’s bank levy. The federal government would be forced to tread a very tight line if they try to argue that it is fine for them to tap the banks’ honeypot but not for the states to do it too.

With new sources of state funding rare, South Australian treasurer Tom Koutsantonis has exploited this political opportunity, potentially signalling a shift of power back to the states. Unsurprisingly, the banks have reacted with fury, mounting their own attack campaign and threatening reprisals.

Taxation powers in Australia

The constitutional validity of South Australia’s bank levy rests on the distribution of taxation powers in the Australian federation. The power of the states has been eroded over time as the Commonwealth gradually came to dominate the federation.

The Constitution assigns almost equal power over taxation to the states and the federal government. Under Section 51(ii) the federal government is granted a power to enact laws with respect to taxation, but “not so as to discriminate between states or parts of states”.

However, Section 90 grants the federal government the exclusive power to impose “duties of customs and of excise”. So a state tax will generally only be constitutionally invalid if it’s characterised as a duty of custom or excise, or if it is incompatible with a Commonwealth Act.

Back in 1942, the federal government used its power under Section 96 to gain an effective monopoly on income tax. Under the scheme, the federal government levied a uniform tax on income, then gave a grant to the states equal to the income tax they had collected on the condition they cease collecting income tax.

In South Australia v Commonwealth (1942), the High Court upheld this effective takeover of income tax. While states retain the right to levy income tax, the risk of losing Commonwealth grants (together with administrative cost and competitive pressures) has made the proposition unattractive.

The federal government has consolidated more power through the expansive definition given by the High Court to the meaning of “duties of excise” in Section 90. For example, in the court case Ha v New South Wales (1997) a majority of the court held that duties of excise are taxes on the production, manufacture, sale or distribution of goods. As this is an exclusive federal government power, the states are effectively prohibited from taxing goods – such as sales tax.


The states have instead been forced to rely on a range of relatively inefficient transaction taxes (that is, stamp duties on certain written documents), on land taxes, and on payroll tax (levied on the wages paid by employers). The narrow base of these taxes has seen the federal government come to dominate taxation revenue – collecting more than 80% of tax revenue in 2015-16.

This “vertical fiscal imbalance” leaves the states dependent on federal government grants, together with any conditions attached to such grants. As Professor Alan Fenna has observed, the states are left:

…scrounging for revenue in economically inefficient or socially undesirable ways and going cap in hand to the Commonwealth.

With opportunities for the states to introduce new forms of taxation being so limited, the proposed South Australian bank levy is something of a game-changer.

The legality of South Australia’s bank levy

The levy’s structure doesn’t appear to involve the taxation of goods in a way that would go against Section 90 of the Constitution. The banks are being taxed on the basis of the value of an asset class they hold – in a way that is comparable to land tax.

Given the small percentages involved, this levy does not seem to interfere with the federal government’s levy, and would arguably not be incompatible with it. While relatively novel, the tax appears on its face to be constitutionally valid.

However, the politics of the issue is far more vexed, as the dark shadows of the federal government tied-grants scheme loom over all matters involving state tax. As Western Australia has learned, raising state taxes can have catastrophic unintended consequences. After that State raised mining royalties during the mining boom, the Commonwealth Grants Commission drastically reduced its share of GST payments - down to 34 cents in the dollar.

The fate of the state levy remains uncertain, with the politics very much in flux. What is clear is that the other states are taking notice.

The ConversationWith growing frustration over fiscal dependence on the federal government, it seems we may be entering a new phase of innovation in state taxation. Perhaps the federation is not yet dead.

Joe McIntyre, Senior Lecturer in Law, University of South Australia

This article was originally published on The Conversation. Read the original article.

Platinum Quarterly Report - a great read

Platinum Asset Management's quarterly report is always full of insightful information about the world economies and financial markets.

The most recent quarter considers the imbalance of investment capital around the world, comparing the economies of US, UK and Australia who all are spending above their income levels (running deficits) versus economies in Europe and Asia who are spending less than their income.  It is indeed thought provoking from the perspective of an Australian investor.

While quite a detailed read, we thoroughly recommend investors take the time to run through this excellent document that is put together by the professional investors who manage the money at Platinum rather than marketing spin doctors.

Australian economy hits rough patch

Despite numerous forecasts for an “unavoidable” recession following the end of the mining boom early this decade, the Australian economy has continued to defy the doomsters and keep growing. However, recently it seems to have hit a bit of a rough patch. After contracting in the September quarter, the economy bounced back in the December quarter only to falter again in the March quarter. While there was relief that we didn’t see another contraction, as had been feared, and the economy has now had 103 quarters without a recession, it would be wrong to get too excited. March quarter growth was just 0.3% quarter on quarter and annual growth slowed to 1.7% year on year, its slowest since the global financial crisis (GFC).
Source: ABS, AMP Capital

Bad weather and bad wages growth – the negatives

Cyclone Debbie and its aftermath disrupted housing construction & trade in the March quarter and this will pass. But before it does, the weather impact on trade will worsen in the current quarter – as indicated by a 45% collapse in coal exports in April, which is unlikely to be made up for in May and June – resulting in another quarter of poor growth. More fundamentally though:

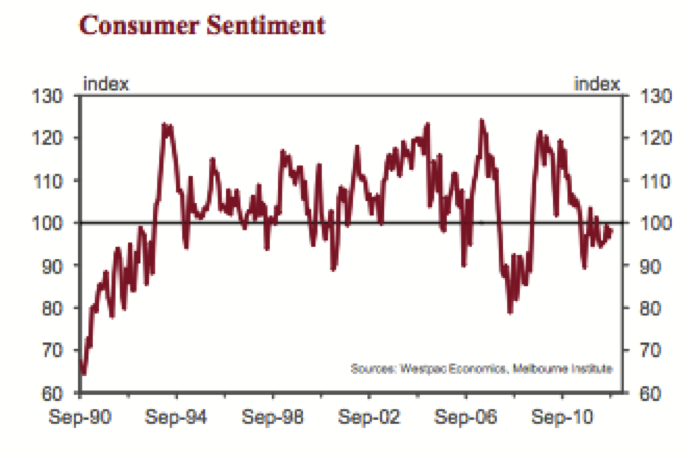
  • http://www.ampcapital.com.au/custom/reskin/images/bg-bullet-dot.png); padding-left: 11px; margin-bottom: 5px; background-position: 0px 8px; background-repeat: no-repeat no-repeat;">Consumer spending is heavily constrained by record low wages growth and high levels of underemployment resulting in real household disposable income growth of just 0.4% over the last 12 months. While real consumer spending grew more strongly than income at 2.3% over the last year, this was only possible because of a fall in the household savings rate to 4.7% from 6.9% a year ago. Rapid increases in the cost of electricity, talk of an increase in the Medicare levy and high debt levels are probably also not helping. All of which is showing up in relatively low levels of consumer confidence.
  • http://www.ampcapital.com.au/custom/reskin/images/bg-bullet-dot.png); padding-left: 11px; margin-bottom: 5px; background-position: 0px 8px; background-repeat: no-repeat no-repeat;">The housing cycle is starting to slow. Falling building approvals point to a downtrend in housing construction activity (see next chart). Similarly, the wealth effects from home price gains are likely to slow if, as we expect, Sydney and Melbourne property price growth has now peaked under the weight of bank rate hikes, tighter lending standards, rising supply and poor affordability.


Source: ABS, AMP Capital

The impact of the housing cycle on the Australian economy is regularly exaggerated. Last year it contributed around 0.3% directly to GDP growth (via housing construction) and indirect effects look unlikely to have been more than another 0.3%. In other words, not a huge amount. But nevertheless it will be a drag on growth when it slows.

Offsetting positives

However, while the consumer and the housing cycle look like becoming a drag on Australian growth in the year or two ahead, several considerations will provide an offset:

  • http://www.ampcapital.com.au/custom/reskin/images/bg-bullet-dot.png); padding-left: 11px; margin-bottom: 5px; background-position: 0px 8px; background-repeat: no-repeat no-repeat;">The big drag on growth from falling mining investment is nearly over.Mining investment peaked at nearly 7% of GDP four years ago and has been falling at around 30% per annum, knocking around 1.5% pa from GDP growth (and a lot more in Western Australia). While it’s still falling rapidly, at around 2% of GDP now, its weight in the economy has collapsed reducing its drag on growth to around 0.5% for the year ahead and it’s getting close to the bottom.

Source: ABS, AMP Capital

  • http://www.ampcapital.com.au/custom/reskin/images/bg-bullet-dot.png); padding-left: 11px; margin-bottom: 5px; background-position: 0px 8px; background-repeat: no-repeat no-repeat;">Secondly, public infrastructure investment is rising strongly, up 9.5% over the last year, in response to state infrastructure spending much of which is financed from the privatisation of existing public assets.
  • http://www.ampcapital.com.au/custom/reskin/images/bg-bullet-dot.png); padding-left: 11px; margin-bottom: 5px; background-position: 0px 8px; background-repeat: no-repeat no-repeat;">Finally, net exports or trade is likely to return to contributing to growth as the impact of Cyclone Debbie fades, resource projects including for gas complete and services exports continue to strengthen.

Source: ABS, AMP Capital

Recession avoided, but growth to remain subdued

These considerations should ensure that the Australian economy continues to grow and avoids recession. However, the drag from soft consumer spending and an end to the east coast housing boom will likely leave growth stuck around 2 to 2.5%. This is below Government and RBA expectations for a return to 3%, posing downside risks to the inflation outlook.

In an ideal world and given the declining potency of monetary policy (and the fear of reigniting home prices gains), this would be the time to consider income tax cuts (or “cheques in the mail”) to help shore up consumer spending. The Government could consider financing this by dropping/delaying the cuts to corporate tax for large companies that are stalled in the Senate. However, since the corporate tax cuts were due to kick in much later, the budget deficit would still blow out in the short term and it’s doubtful the Government would want to allow this given the risk of a ratings downgrade.

As a result, the pressure to do something if growth remains sub-par and underlying inflation stays below target will fall back to the RBA. As such our view is that the chance of an interest rate hike in the next 12 months is very low and the probability of another rate cut has pushed up to around 40-50% (well above the probability implied by the money market of 11%). Yes, the RBA remains reluctant to cut rates again and showed no signs of an easing bias in its June post-meeting statement, but then again it’s been a reluctant rate cutter all the way down since 2011. Key things to watch for another rate cut are: a softening in jobs data; continued weak consumer spending; another downwards revision in RBA growth and inflation forecasts; significant cooling in the Sydney and Melbourne property markets; and the Australian dollar remaining relatively resilient.

Implications for investors

There are two major implications for Australian based investors. First, continue to favour global over Australian shares. While US and global share indices are hitting new record highs, Australian shares remain well below their pre-GFC peak. In fact, Australian shares have been underperforming global shares since October 2009. See the next chart. This reflects relatively tighter monetary policy in Australia (the US had money printing and zero rates and Australia had neither), the commodity slump, the lagged impact of the rise in the $A above parity in 2010 and a mean reversion of the 2000 to 2009 outperformance by Australian shares. While the underperformance has reversed half of the 2000 to 2009 outperformance, it looks like it has further to go reflecting weaker growth prospects in Australia. We see the ASX 200 higher by year end, but global shares are likely to do better.
Source: Thomson Reuters, AMP Capital

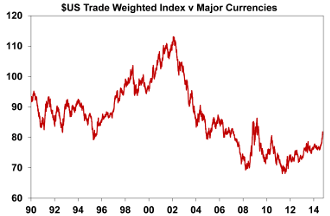
Secondly, maintain a decent exposure to foreign currency. A simple way to do this is to leave a proportion of global shares unhedged. Historically the $A has tended to fall against the $US when the level of interest rates in Australia relative to the US is falling. See the next chart. With the Fed likely to continue (gradually) raising rates and the RBA on hold or potentially cutting rates again, the risk for the $A remains down.

Source: Bloomberg, AMP Capital


Article by Shane Oliver - Chief Economist AMP

SA Bank Levy - Fact or Crap

With SA Treasurer, Tom Koutsantonis announcing in the budget recently, a state based bank levy, we examine his assertions in a game of "Fact or Crap"

1. Tom Koutsantonis asserts that a new tax on the banking sector will ensure 'the sector contributes their fair share'.  

The fact of the matter is that last year alone, the banking industry paid over $14bn in tax.  In terms of tax paid, it is banks first, daylight second.  Banks make the highest contribution by far to help governments at all levels fund essential public services such as hospitals, schools and roads, and income support for those in need.  In fact, banks paid 55.3% of all tax paid by Australia's top 200 listed companies.  Food and Staples retailing paid 5.4% and the Metals and Mining industry paid 3.8%.  Source of this information is special report published by Australian Bankers Association.

Therefore we declare Tom Koutsantonis' first assertion is CRAP.


2. Tom Koutsantonis asserts that banks are earning super profits and therefore should pay more tax.


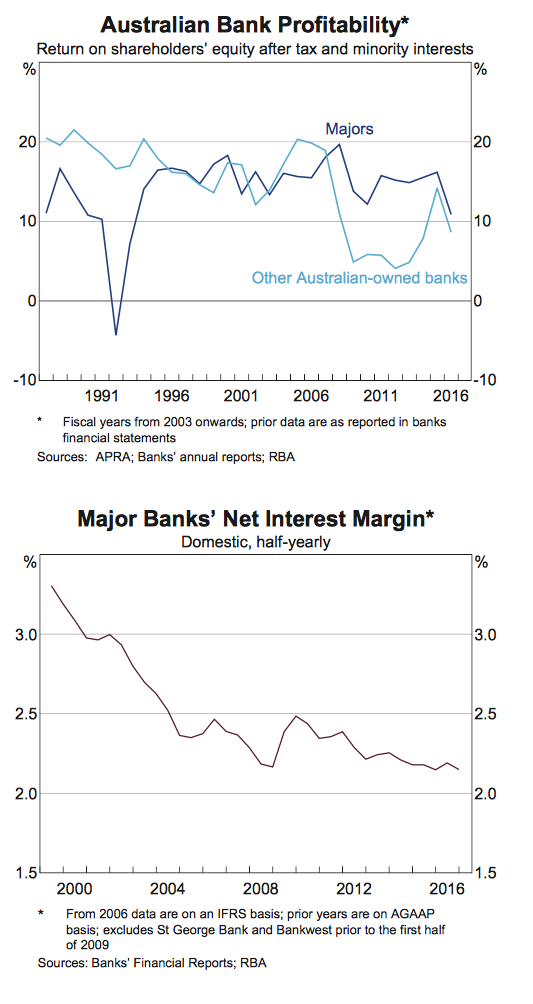
If banks in Australia truly were earning 'super profits' investors would clearly be able to see a material increase in financial ratios such as bank margins, and return on equity.  The first chart shows return on equity over the past 30+ years.  If banks were earning super profits this graph would show an increased return on equity, whereas the fact of the matter is that return on equity has been relatively stable over the past 30 years.  And while Australia's banks are profitable, this is something that Australians actually benefit from not only in their superannuation fund investment returns, but also having access to credit from a stable financial system to purchase houses, cars, businesses etc.   

The second chart shows the journey of bank interest margins over the last 20 years.  If banks were making super profits, margins would not be decreasing which is clearly what the chart demonstrates.

Tom Koutsantonis' second assertion is also CRAP.


3. Tom Koutsantonis asserts that banks should pay extra tax as they have closed branches.

We sourced information from the IMF Financial Access Survey (2015) which outlined the number of Commercial Bank branches per 100,000 adults and some of the key results are as follows:


Australia 28.7 branches per 100,000 adults

Canada 23.6

Germany 14.1

Greece 26.8

Netherlands 13.9

Norway 7.7

North America 28.2

OECD Average 23.6


Arguing an organisation which rationalises its physical locations should pay higher tax liabilities would result in some interesting tax outcomes for the likes of Book stores, Record/CD shops and of course Video rental shops that have all changed materially at the hands of technology.

Australia has one of the highest rates of bank branches to populations in the world, and it is with this in mind that we declare that Tom Koutsantonis' third assertion is also CRAP.


And for further interest from the same IMF report, Australia has 164 ATM's per 100,000 adults, providing ease of access to cash.  This compares to OECD average of 75.9 ATM's per 100,000 adults, further demonstrating that banks provide an above average service to Australians.


GEM Capital believes it is poor policy to single out an industry and impose a specific levy in a particular geographic location.  This is likely to distort the integrity of the tax system in Australia and lead to poor economic outcomes for South Australia.


We conclude this article by quoting some interesting sources who have shown their concern about the proposal to introduce a state based levy in South Australia on the banks:


"My concern is that it will damage investment.  It's quite a different set of circumstances from the federal tax".  "A state based levy could make the region uncompetitive" - Nick Xenophon, who is opposing the SA Bank Levy.

"There is no justification for this state tax other than a grab for revenue.  It is clearly open season for governments attacking big banks, but it is their shareholders who will bear these added taxes"  Ross Barker - Australian Foundation Investment Company

"In the case of South Australia the tax is avoidable by not doing business there and that's a very bad outcome for bank customers of that state" - David Murray former CEO of Commonwealth Bank

 "Koutsantonis shows his lack of understanding of the profitability of the banks relative to their capital by quoting the annual profits number..... and he might get a shock when they start shutting down local operations in Adelaide in response to the tax, which woul be a rational response"  Tony Boyd Australian Financial Review

"Australia is becoming a laughing stock of global investment circles as erratic governments - state, territory and federal - carelessly undermine confidence by chop and changing the rules of doing business" Jennifer Westacott - Business Council of Australia


GEM Capital is concerned at the anti-business messages the SA Government is promoting in this levy and believes it is highly likely to result in reduced investment in South Australia which is likely to result in reduced employment over time.  From an investment perspective, actions of Australian Governments like this are materially increasing "Sovereign Risk" of investing in Australia which is also likely to negatively impact the Australian economy over time.  It very much validates our view to look to continue to invest outside of Australia in search of investment returns.


These opinions are my personal views and not necessarily those of the Dealer Group we are licensed through.


Government spending explained in 10 charts (Howard to Turnbull)

Alan Duncan, Curtin University and Rebecca Cassells, Curtin University

Successive Australian governments are usually judged on how they balance the budget and spend taxpayers’ dollars. The stereotypes are that Liberal governments keep a tight hold on the purse strings, while Labor governments are spendthrifts. The Conversation

While total government spending has increased from around A$240 billion in 1998-99 to a predicted A$451 billion in the 2016-17 financial year, it’s also accompanied by an increase in revenue from around A$250 billion to A$417 billion over the same period.

But the pressure on the budget under a Turnbull government is more acute now than ever before, because spending is outpacing revenue. It’s now at an estimated 26.6% of GDP in 2016-17, higher than at any point since before the start of the millennium.

When you look at the mix of government spending over the past fifteen years, you start to see some of the drivers of the growth.

To compare spending over time, we have adjusted for the effect of inflation by using real measures.

The Conversation/Emil Jeyaratnam, CC BY-ND

Social security continues to dominate government spending at A$161.4 billion, constituting around 35% of all government outlays on latest figures. This has fallen from a high of 39% during the Rudd government stimulus package in 2009-10 and is similar to levels at the beginning of the millennium.

In the graph below “other” spending includes the distribution of GST revenues to states and territories as well as spending in areas such as job seekers assistance, industrial relations, vocational training, tourism and immigration. This constitutes the second highest share of government spending, at 18% (A$83.4 billion) of the total spend. General revenue assistance to states and territories accounts for two thirds of spending in this category.

Governments spend almost as much on defence and public safety (around A$32.6 billion) as they do on education (A$34.3 billion), although the states ultimately pick up most of the education bill.

The global financial crisis saw a temporary blip in the mix of general government spending. Social security spending rose by 22% in the year to June 2009, and education expenditure jumped 60% a year later as a result of Rudd’s economic stimulus package.

Government spending on public debt interest has more than tripled in real terms to A$15.4 billion since the start of the global financial crisis, and now accounts for 3.7% of all government spending.

The Conversation/Emil Jeyaratnam, CC BY-ND

Many of the changes in real government spending between 2008 and 2010 were driven by the impact of the global financial crisis, which resulted in a slowdown in economic growth, rising unemployment and a negative hit on the sharemarket.

The Rudd government response was a stimulus package. The main spending increases came from a combination of accelerating public debt interest, increased payments to assist the unemployed, but mainly the government’s stimulus measures channelled through increased spending on education, housing and cash payments to families.

If a spending measure is truly temporary, a rise in real spending should be followed by an equivalent fall in subsequent years when the spending runs out or the program ends. This is evident to some degree for the social security and welfare and fuel and energy portfolios, but less so in other areas.

For example, the 45% rise in fuel and energy spending in 2008-09 was primarily driven by the introduction of the Energy Efficient Homes package within the Rudd stimulus suite. The scheme ended in February 2010, resulting in a 33% drop in spending.

On the other hand, spending on education rose by A$16 billion as part of the Rudd stimulus package, but remained A$10 billion higher than pre-global financial crisis levels in subsequent years.

Overall government spending has continued to grow since 2010-11, but less dramatically than during the heart of the global financial crisis, by around 8% in real terms over the five years to 2015-16.

The Conversation/Emil Jeyaratnam

Social security and welfare spending constitutes the largest spending commitment of any government budget. It has risen by 70% in real terms over the past fifteen years, from A$91 billion at the turn of the millennium in 1999-00 to A$155 billion in 2015-16.

The biggest welfare spending is for assistance to the aged, families with children and people with a disability. Together, these three items make up almost 85% of all welfare spending.

The 2008-09 Rudd stimulus package had a substantial yet temporary effect on welfare spend, with “bonus” cash payments to families in the 2009 calendar year increasing assistance to families by around A$10 billion. Additional cash payments were also made to students, pensioners and farmers under the stimulus program. And 8.7 million Australian workers earning $100,000 or less also received a cash payment.

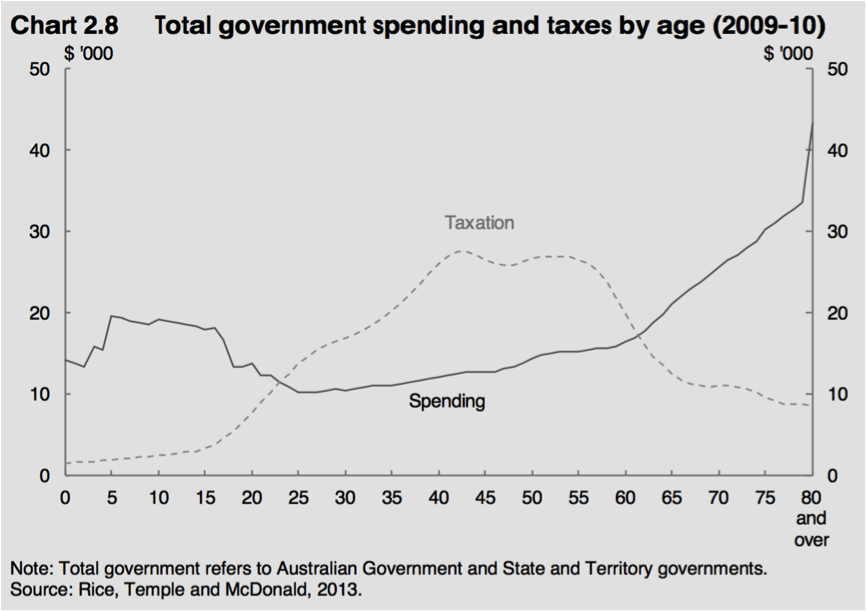
Australia’s ageing population and increases in both disability prevalence and disability support are the main driving forces behind welfare spending growth. These factors will continue to exert pressure on future government budgets, especially with the full rollout of the National Disability Insurance Scheme (NDIS).

The Conversation/Emil Jeyaratnam, CC BY-ND

More than 40% of the government’s 2015-16 health budget of around A$71.2 billion was committed to community health services spending. At A$28.7 billion, spending in this sector has nearly doubled since the start of the millennium and by a quarter since the start of the global financial crisis in 2008-09.

This stems from the need to deliver medical services to a growing – and ageing – population, and the increased prevalence of chronic disease. In this respect, Australia is little different to most countries around the world.

Specific measures contributing to this growth included the expansion of health infrastructure, the costs of enhanced primary care attracting higher Medicare rebates, and indexation of health related payments to states and territories. Pharmaceutical spending increased by 12%, from A$1.4 billion year-on-year to A$12.1 billion in 2015-16.

The Conversation/Emil Jeyaratnam, CC BY-ND

Education spending rose dramatically during the global financial crisis, with spending on primary and secondary education increasing 81% to A$24.7 billion in the year to 2009-10 as part of the economic stimulus package.

Rudd’s “education revolution” led to a 12% growth in education spending in the 2008-09 budget, quickly followed by a further 61% spending increase in 2009-10 as part of the economic stimulus package. Spending in the following year fell as the temporary stimulus measures came to an end, but overall, education spending has remained significantly higher in real terms than pre-global financial crisis levels.

Spending on the university sector rose to around A$10.9 billion over the same period, but has remained relatively stable since.

The Conversation/Emil Jeyaratnam, CC BY-ND

Federal government money given to the states and territories

The federal government committed A$60.8 billion in general revenue assistance to states and territories in 2015-16, almost all of which came through the distribution of GST revenue. General revenue assistance spending rose A$3.8 billion in real terms in 2014-15, up 7% on the previous year, but has since stabilised.

Spending on superannuation interest has grown by a quarter since the end of the Howard years, reflecting the increase in the government’s superannuation liability. Lower public sector wages and employment have led to superannuation interest payments stabilising over the last two budgets to around A$9.4 billion in 2015-16.

Immigration spending rose between the Gillard and Abbott governments to a peak of A$4.7 billion in 2013-14, but has since fallen back to around A$3.8billion in 2016 dollars.

Much of the growth in immigration spending occurred during the Rudd and Gillard governments, by an average of 23% annually. This compares to an average of 7% during the previous Howard years. Additional government spending on detention facilities for irregular arrivals was the principal reason for this spending growth.

Natural disaster relief spending spiked between 2009 and 20-11 to assist with the damage and recovery costs from the Black Saturday bushfires in Victoria in 2009, and the 2010 Queensland floods.

The Conversation/Emil Jeyaratnam, CC BY-ND

Government approaches to supporting various industries has typically been applied on an ad hoc basis. Budget spending on specific industries has risen from A$3.2 to A$5.6 billion in real terms. Agriculture, forestry and fishing typically received a greater share of industry spending during the Howard budgets, reaching a high of A$4.8 billion in Swan’s final 2007-08 budget.

Growth in industry spend slowed during the Rudd years, picking up again with the Gillard and Abbott governments, with a greater preference towards spending in mining, manufacturing and construction projects.

The Conversation/Emil Jeyaratnam, CC BY-ND

Spending on housing and community amenities has increased from A$2.7 billion to A$7.6 billion, reaching a high of almost A$12 billion in the Rudd years. Spending in this portfolio increased with the Rudd stimulus package, incorporating a number of housing affordability measures including the First Home Buyers Grant Scheme and a boost in investment in social housing.

Spending on sanitation and protection of the environment also expanded rapidly during the Rudd/Gillard government, relative to the Howard years. The establishment of the Climate Change Action fund introduced by Rudd in 2009-10 and the Clean Energy Futures package in 2010-11 have been the main drivers behind this increase. Spending in each has been pared back since the Liberals came to power with Abbott at the helm.

The Conversation/Emil Jeyaratnam, CC BY-ND

Commonwealth spending on transport and communications projects has more than doubled from A$3.1 to A$7.5 billion over the last 15 years. Spending remained relatively stable under Howard’s government, and then got a further injection on roads in the last two Swan budgets. The Rudd government continued this trend, with Gillard following suit with increases in both road and rail projects.

Spending in this portfolio has been clawed back since the Abbott government, falling from A$9.2 billion to A$7.8 billion between the final Labor government budget (2013-14 financial year) and the first Liberal government budget (2014-15 financial year). The most recent Turnbull/Morrison budget has reaffirmed spending commitments under this portfolio, committing to more than A$11 billion in 2016-17.

The Conversation/Emil Jeyaratnam, CC BY-ND

The Howard/Costello years were characterised by good economic times, with an extended period of strong revenue growth, yet this prosperity wasn’t matched with any significant spending growth. In fact, overall government spending fell as a share of GDP – from 25.7% in 2000 to 23.6% in 2006-07 – the lowest share since the start of the millennium. And the combination of strong revenue and limited spending commitments under Howard drove down public debt, and public debt interest payments.

We saw some pretty dramatic increases in real spending when Rudd came into power in December 2007. Rudd’s first budget in 2008-09 saw some substantial spending commitments in the area of education but nothing exorbitant.

However, the major turning point in government spending has been driven by the response to the global financial crisis. There were significant spending commitments over the course of the crisis, some of which are still present.

Spending on public debt interest has increased to A$15.4 billion since the global financial crisis - more than the spending on transport and housing combined. And it’s projected to increase further to A$18.7 billion by 2019-20. This just emphasises how high the stakes are for Scott Morrison in delivering a credible budget repair strategy.

The spending of incumbent governments inevitably draw from the commitments of previous administrations, especially for those programs – in infrastructure, education or housing - that involve medium-term funding commitments.

The growth in real spending in areas that directly affect households – social security, NDIS, health or pensions - is an issue that no government can ignore. NDIS costs have been hugely underestimated already, and social security and health spending will inevitably increase with the ageing population.

Set against this context, it’s clear that a piecemeal approach to budget repair is unsustainable. A drop in revenue has ramped up budget pressures, and highlights the compelling need to return to a sustainable spending path and a credible budget repair strategy.

The Turnbull government cannot shy away from making the big decisions that secure a sustainable future for Australia. And the roadmap towards a sustainable future has to include revenue as well as spending as part of the recovery narrative.


The graphs in this article were created by The Conversation’s Multimedia Editor Emil Jerayatnam

Alan Duncan, Director, Bankwest Curtin Economics Centre and Bankwest Research Chair in Economic Policy, Curtin University and Rebecca Cassells, Associate Professor, Bankwest Curtin Economics Centre, Curtin University

This article was originally published on The Conversation. Read the original article.

Amazon is coming to Australia - will it be the death of retail as we know it?

It has been rumoured in many media outlets that Amazon will commence operations in Australia next year.  Richard Goyder (CEO Wesfarmers) has often quipped that Amazon won't just 'eat our lunch, they will eat breakfast and dinner too'.  So with such a large threat to the status quo of retailing in Australia, many of whom enjoy some of the largest retailing margins in the world, we examine what this may mean for investors.

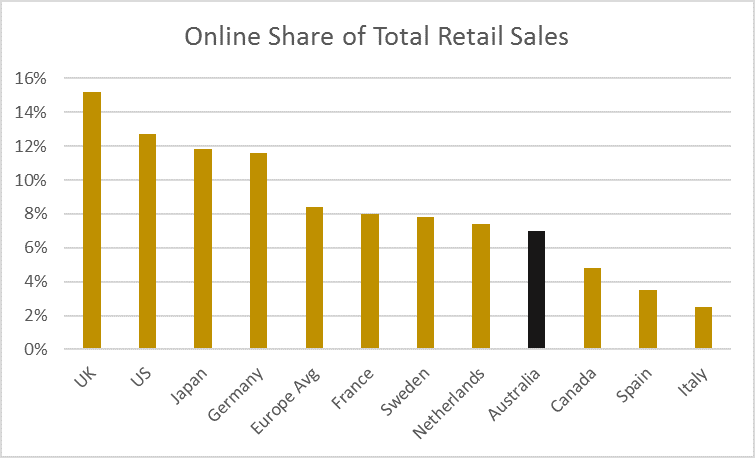
It may comes as a surprise  that online penetration is less than 15% in most developed countries - in fact many countries online presence is below 10%.

Source:  Forager Funds Management


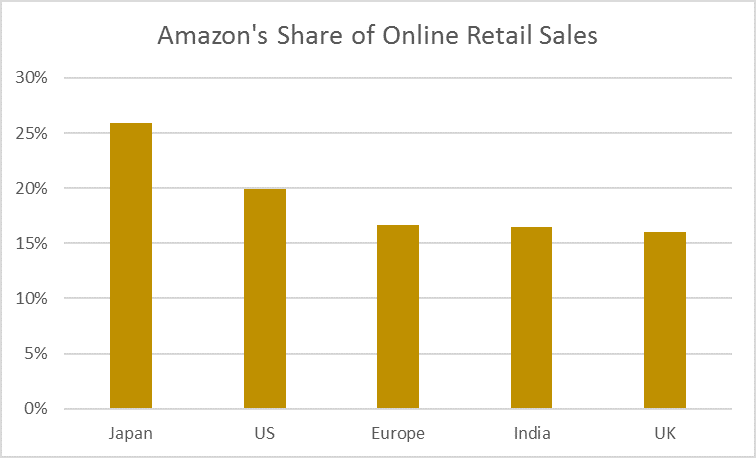
Clearly when Amazon commences operations in Australia, there will be much fanfare, but investors need to ask how much market share are they likely to pick up.  the next chart shows Amazon's share of online retail sales.  While Amazon is the largest online retailer in the US and Europe, it by no means has a majority share of these markets.  Globally it tends to gain about a 15-20% share of e-commerce.  If the same mathematics was applied to the Australian market, Amazon could expect to gain around 1 - 1.5% of total retail sales.

Source:  Forager Funds Management


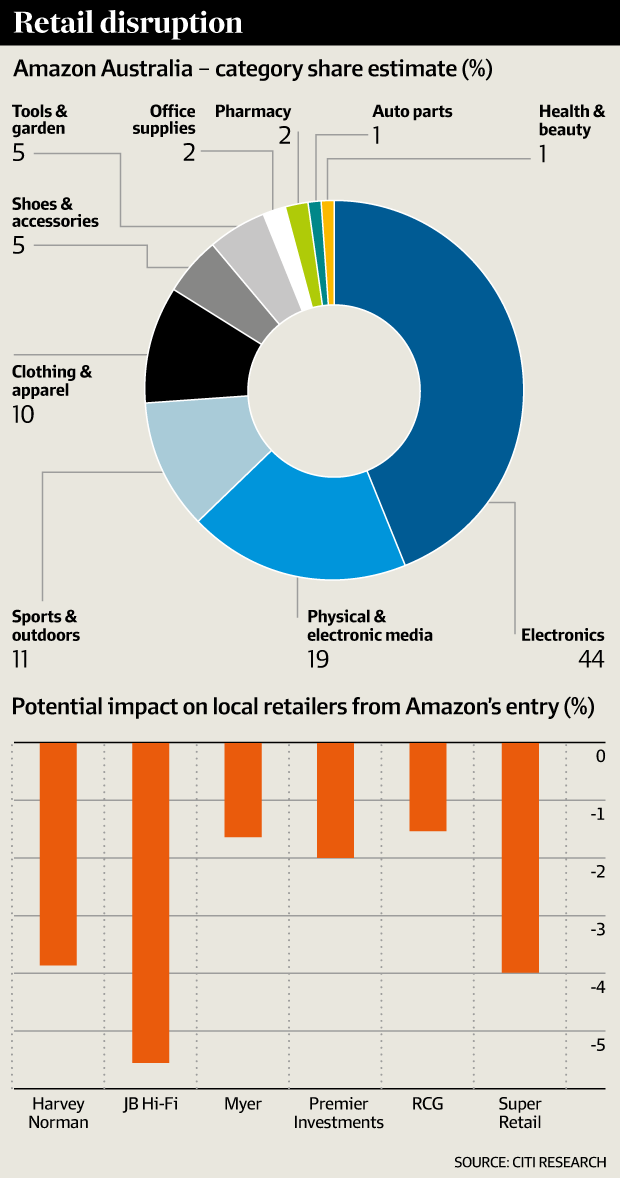
Finally we consider that not all retailing is equal when approaching the idea of online sales.  The furniture division of Amazon has been a 'disaster' while apparel and electronics have shared greater success.  When we approached the subject with senior management at Perpetual, they said "Fresh Food would be almost impossible for Amazon".  The last chart is a summary from the Aust Financial Review outlining the view of Citigroup of the market share that Amazon is likely to gain in each market segment.  The chart also highlights an estimate of earnings lost by the incumbent retailers assuming these market share estimates prove correct.


We have nothing but respect for Amazon and their business model, and investors are encouraged to ensure that their investment strategy takes into account the likely entry of Amazon into the Australian market in 2017.

Trump Presidency could bring a range of economic disasters

Saul Eslake, University of Tasmania

Opinion polls, statistical prediction models and betting markets are now all predicting a fairly comfortable victory for Hilary Clinton in the United States presidential election. However, they all said much the same about the prospect of British voters opting to remain in the European Union, before a majority of them actually voted to leave at the Brexit referendum in June.

In Brexit those wanting “change” felt much more strongly about it and were thus more inclined to vote, than those favouring the status quo. This might also be the case with Trump voters. So the possibility of a Trump victory can’t be entirely dismissed – and the possible economic consequences of such an outcome are worth considering.

Precisely because a triumph for Trump has by now been so widely discounted – including by the financial markets – this outcome would prompt a much larger financial market reaction than a Clinton victory.

The unexpected outcome of the Brexit referendum saw the London share market fall by more than 5%, and the British pound by more than 8%, in the following 24 hours. And although the share market has since more than recouped its initial losses, the pound is now almost 18% below its pre-referendum level against the US dollar.

The financial market reaction to a Trump victory in the US presidential race is likely to be sharper. As the Reserve Bank of Australia governor Philip Lowe noted earlier this month, “the possible election of President Trump wouldn’t be as benign an event”, as Brexit turned out to be. A paper published this week by Justin Wolfers and Eric Zitzewitz (of the University of Michigan and Dartmouth College, respectively) suggests that the US, UK and Asian share markets could fall by 10-15%, and that the Mexican peso would fall by 25%, in the event of a Trump victory.

From an historical perspective this is an extraordinary prospect, given that, as Wolfers and Zitzewitz note:

In almost every case back to 1880, equity markets have risen on the news that Republicans win elections and fall when Democrats win.

This is also because, at least superficially, Trump is proposing policies that are more likely to benefit rich households (who are more likely to own equities), while Clinton is explicitly advocating higher taxes on capital.

These findings are more understandable in the light of mainstream economists’ assessments of the likely implications of the policy proposals put forward by the two main contenders. Out of 414 respondents to a survey conducted by the US National Association of Business Economists, 55% thought Hilary Clinton would “do the best job as president of managing the economy”.

Only 14% thought that Donald Trump would (and that was 1 percentage point less than the proportion who nominated Libertarian Party candidate Gary Johnson). It’s perhaps worth emphasising that this was a survey of business, not academic, economists.

This overwhelming view likely reflects three particularly important concerns to mainstream economists about the Republican presidential candidate’s policies.

Differences in policies

Donald Trump’s policies would significantly increase the US Budget deficit. The bipartisan Committee for a Responsible Federal Budget (CRFB) last month estimated that the combination of tax cuts and spending increases proposed by Donald Trump would add US$5.3 trillion to US public debt over the next decade, lifting it from 77% to 105% of GDP.

Hillary Clinton’s policies would add US$200 billion to public debt in the next decade, despite her recent claim that she will ‘not add a penny to the debt’. Mike Blake/Reuters

By contrast, the spending and tax measures (cuts for some, increases for others) advocated by Hilary Clinton would boost public debt by US$200 billion, to 86% of GDP, over the next decade. A more recent analysis of Donald Trump’s tax proposals by the Urban Institute and Brookings Institution’s Tax Policy Center suggests that they would increase US Federal debt by US$7.2 trillion over a decade.

While both candidates assert that their policy proposals would boost economic growth, which would in turn result in lower (rather than higher) budget deficits, the Committee for a Responsible Federal Budget (CRFB) calculates that economic growth would need to average 3.5% per annum over the next decade in order to stabilise the debt-to-GDP ratio without further tax increases. According to the CRFB, that would “likely require a level of productivity growth that has not been achieved in any decade in modern history”. Whereas the same objective would require economic growth averaging 2.7% per annum under Hillary Clinton’s proposals.

In addition to this, Donald Trump has consistently advocated a major upheaval in US trade policies, including the repudiation of the North America Free Trade Agreement (NAFTA) and the designation of China as a “currency manipulator”. This is something which under existing US trade laws would allow the imposition of tariffs of up to 45% on goods imported into the US from China.

The greatest adverse impact of such measures would be on low-income households in the US, as the result of having to pay much higher prices for goods that make up a large proportion of their spending. But there would also be an obvious negative impact on the Chinese economy – since China’s exports to the US account for 18% of its total exports, and just under 4% of China’s GDP.

It’s also hard to imagine that China wouldn’t seek to retaliate in some way against any such measures by a Trump Administration. In a study published by the Petersen Institute, Marcus Nolan, Sherman Robinson and Tyler Moran suggest that in such circumstances, the US economy would experience a recession in 2018 and 2019, with unemployment rising to 8.6%.

It’s hard to imagine how a trade war between the world’s two largest economies, Australia’s largest and third-largest trading partners, could have anything other than negative consequences for Australia.

Current US president Barack Obama tried to forge closer ties with China over his two terms. Stephen Crowley/Pool/Reuters

Another concern for mainstream economists arising from Donald Trump’s economic agenda is his contempt for the independence of the US Federal Reserve. Trump’s suggestion that the Federal Reserve should have been more willing to raise US interest rates this year is not without some basis.

But his personal criticisms of Federal Reserve Chair Janet Yellen, combined with the fact that there are already two unfilled vacancies on the Fed’s Board of Governors, suggests that the Fed could quickly become much more politicised in the event of a Trump victory. That would likely undermine confidence in US monetary policy, potentially leading in turn to a weaker US dollar and higher US bond yields.

Relationships between the US and other nations

Beyond these concerns to mainstream economists, the Republican candidate’s attitude to longstanding US strategic alliances – with European countries, Japan and Korea – threatens to create much greater political uncertainty around the world. It may even prompt an “arms race” entailing greater proliferation of nuclear weapons.

Trump hasn’t specifically listed Australia as being among the US allies who “aren’t paying anywhere near what it costs to defend them”. It could be that Australia’s status, as one of the few countries with which the US runs a trade surplus, puts us in a different category. Nonetheless, a deteriorating regional security environment could result in the Australian government concluding that it needs to spend more on defence.

It’s important to note that not all of the foregoing concerns will be completely alleviated should, as seems more likely, Hillary Clinton becoms the 45th President of the United States. If that result were to be accompanied by a “clean sweep” of both the Senate and (less likely) the House of Representatives, left-wing Democrats such as Elizabeth Warren and Bernie Sanders will have a much larger influence on US economic policy.

The differences between Donald Trump and the left wing of the Democratic Party on trade policy, or on the independence of the Federal Reserve, are in reality quite small. So while a Clinton victory on 8th November is much the better outcome from an Australian perspective, it would not be in Australia’s interests for her to win too well.

The Conversation

Saul Eslake, Vice-Chancellor’s Fellow, University of Tasmania

This article was originally published on The Conversation. Read the original article.

Brexit stage right - what it means for Australia

Ben Wellings, Monash University

Britain’s decision to leave the European Union has opened a fundamental crack in the western world. Australia’s relationship with the United Kingdom is grounded in the UK’s relationship with the EU.

Given Australia’s strong and enduring ties with the UK and the EU, the shockwaves from this epoch-defining event will be felt in Australia soon enough. Most immediately, the impending Australia-EU Free-Trade Agreement becomes more complicated and at the same time less attractive.

What will happen to trade ties?

The importance of Australia’s relationship with the EU tends to get under-reported in all the excitement about China. We might ascribe such a view to an Australian gold rush mentality. Nevertheless, Australia’s trading ties to the EU are deep and strong.

Such ties looked set to get stronger. In November 2015 an agreement to begin negotiations in 2017 on a free-trade deal was announced at the G20 summit in Turkey. Trade Minister Steven Ciobo said in April 2016 that an Australia-EU free trade agreement:

… would further fuel this important trade and investment relationship.

When considered as a bloc, the EU consistently shows up as one of Australia’s main trading partners. Consider the statistics below:

  • in 2014 the EU was Australia’s largest source of foreign investment and second-largest trading partner, although the European Commission placed it third after China and Japan in 2015;

  • in 2014, the EU’s foreign direct investment in Australia was valued at A$169.6 billion and Australian foreign direct investment in the EU was valued at $83.5 billion. Total two-way merchandise and services trade between Australia and the EU was worth $83.9 billion; and

  • the EU is Australia’s largest services export market, valued at nearly $10 billion in 2014. Services account for 19.7% of Australia’s total trade in goods and services, and will be an important component of any future free trade agreement.

This is all well and good. But when not considered as a bloc, 48% of Australia’s exports in services to the EU were via the UK; of the $169 billion in EU foreign direct investment, 51% came from the UK; and of Australia’s foreign direct investment into the EU, 66% went to the UK.

You get the picture.

The UK was Australia’s eighth-largest export market for 2014; it represented 37.4% of Australia’s total exports to the EU. As Austrade noted:

No other EU country featured in Australia’s top 15 export markets.

In short, the EU is not as attractive to Australia without Britain in it.

Beyond trade numbers

But the Australia-EU-UK relationship cannot be reduced to numbers alone. It also rests on values shared between like-minded powers.

Brexit represents the further fracturing of the West at a moment when that already weakening political identity is in relative decline compared to other regions of the world, notably Asia (or more specifically China).

EU-Australia relations rest on shared concerns such as the fight against terrorism advanced through police collaboration and the sharing of passenger name records. The EU and Australia also collaborated to mitigate climate change at the Paris climate summit. And they work for further trade liberalisation in the World Trade Organisation – but don’t mention agriculture.

Without the UK, these shared political tasks become harder.

Clearly, Australia-UK relations rest on a special historical relationship. However, it has seen efforts at reinvigoration, as British governments buckled under the pressure of the Eurosceptics among the Conservatives.

David Cameron addresses the Australian parliament in 2014.

Beyond everyday trade, historical links have been reinforced through the centenary of the first world war and the UK-Australia commemorative diplomacy that has come with this four-year-long event.

Cultural ties are most regularly and publicly affirmed through sporting rivalries such as netball, rugby and most notably cricket. Expect these ties to be reinforced as the UK seeks trade agreements and political support from its “traditional allies”.

For those with British passports, there will be a two-year period of grace as the UK negotiates its exit. After that, it will be quicker to get into the UK at Heathrow, but this might be small consolation for the loss of a major point of access to the EU.

The vote to leave is a major turning point in Europe’s history. It marks a significant crack in a unified concept of “the West”. It is not in Australia’s interests.

It’s time for Australia to make new friends in Europe.

The Conversation

Ben Wellings, Lecturer in Politics and International Relations, Monash University

This article was originally published on The Conversation. Read the original article.

Woolworths and Coles should heed simplicity lessons from Aldi

Richard L. Gruner, University of Western Australia

Woolworths is ditching its Select private label range. It intends to launch a new brand for a more focused range of products that promises more bang for the buck. The move comes after Woolworths decided in March to axe its Homebrand label as part of its strategy to compete with Aldi.

The move makes sense, but will likely do little to restore consumer trust and sales growth.

Management guru Michael Porter has long argued that products need a clear positioning in consumers’ minds as either special and expensive or convenient and cheap. Woolworths Select was neither, stuck somewhere in the middle. This positioning was confusing for customers.

But will fixing this problem make a difference, and perhaps even keep growing Teutonic supermarket force Aldi at bay?

Unlikely. After all, similar efforts are only baby steps towards what truly distinguishes growing companies: the ability to make consumers' lives simpler. Think of Uber, Netflix, Amazon, but also Aldi. That’s the common denominator.

And yet, research shows that most companies keep confusing the gobbledegook out of us. A lot has been written about how consumers get more than they want, and how more product choice often makes us less happy.

But consumer confusion extends to other tactics too, like pricing and discounting. Shoppers increasingly ask questions such as: why are some products almost always on special (while others never are)? Do half-price offers mean that we usually pay twice as much as we should?

At best, discounts have become meaningless. While discounts were used successfully in the past to move excess merchandise, they have become ubiquitous and permanent, providing little incentive to respond. It’s a bit like the guy in the audience of a stadium that stands up to see more: it’s an effective tactic so long as not everyone else is standing up too.

Another major concern that emerges is product claims and packaging; for example, most consumers do not know the difference between “Product of Australia” and “Made in Australia”.

Also, products claiming to be “natural”, “real”, or “healthy” are usually hiding behind meaningless terms, undefined in labelling law and merely meant to persuade rather than inform people. The result is ever more confusion.

So what should brands do to simplify the consumer experience? Ironically, the answer to this question is not simple. It takes an awful lot of work to make things less confusing. An app that you visit once in a while and find easy to navigate may be the result of years of painstaking work, with many difficult decisions made behind the scenes about what should go where, and just as importantly, what to leave out.

Companies should start making every aspect of their product offerings simpler. Consumers do not appreciate clutter; they appreciate everything being transparent, clean and easy.

Marketers should understand that consumers rarely inherently care about brands. In some countries, only about 5% of brands would truly be missed. Whether consumers order an Uber ride, or buy a carton of milk, they often want to invest the least amount of effort and time in making the right decision.

Overloading consumers’ already saturated brains with all kinds of marketing tactics, including dynamic pricing and even heavy discounts can backfire or fall flat. This was clear when consumers showed a lack of interest in even 90% discounted product at Dick Smith’s closing down sale.

Instead, every decision brands make should be guided by a desire to help customers feel confident about their choices. Fortunately, we can learn from a handful of companies that have long understood the principle of simplicity in driving customer satisfaction.

Aldi’s success, for example, is often attributed to its simple business model of providing consistently low and transparent prices for a reduced range of high quality products.

No discounts, no confusing ads, no loyalty cards, no bullshit.

The Conversation

Richard L. Gruner, Asst Professor, University of Western Australia

This article was originally published on The Conversation. Read the original article.

Cheap milk is a global issue - don't blame the supermarkets

John Lingard, Newcastle University

British dairy farmers are once again protesting over the low prices on offer for their milk. They worry that too many producers are going bust, and that long-term milk supplies are at risk.

Supermarkets are usually cast as the villains in this piece and this time it is no different. Farming unions are meeting Morrisons to ask for a fairer deal – and protesters in Stafford even took two cows into an Asda branch to help make their point.

However it is too simplistic to blame the supermarkets – the real problem is global. Too much low-value milk is being produced around the world.

Too much milk …

Over the past decade, UK milk production averaged 14 billion litres per year, of which around 500m litres are exported. Just 139m litres are imported. Milk made in the UK tends to stay in the UK.

What happens to that 14 billion litres? Defra

Nonetheless the number of dairy farmers continues to decline, from 40,000 at the start of the 1990s to 14,159 in 2013. This is alarming to some, but it shouldn’t be. For long-term security of milk supplies, it doesn’t really matter how many dairy farmers pack up production. The cows often move to another farm and it is easy enough to step up production through more intensive feeding and selective breeding.

After all, even though the total number of cows in the UK has halved since the 1970s, production has remained steady thanks to the fact average yields have doubled. Farmers are literally squeezing more out of each cow.

… that no one wants

Half of domestic milk production has to be diverted from the more lucrative liquid market into cheese, yoghurt, ice cream, butter and other manufactured products.

This is partly because people drink a lot less milk these days; from five pints per week in the 1960s to around three pints today. Consumption is down 8.1% in the past ten years alone. Any industry would struggle in such circumstances.

This supply and demand problem is replicated across the world – and there is currently a massive oversupply of manufactured milk products on world markets due largely to increased production in China, India, Brazil and New Zealand (where they are dealing with similar issues).

Got milk? gwire, CC BY

This surplus, combined with a collapse in global demand especially in China, has depressed prices. A Russian import ban in retaliation for EU action over Ukraine has also hit prices. Russia used to buy 27% of the EU’s cheese exports and 19% of its butter.

The Global Dairy Trade auction, the industry’s main dairy commodities index, hit a 13-year low in August 2015. The GDT has now lost 64% of its value since a record high in February 2014.

What this means for your local farmer

The amount paid to farmers – the UK’s farm gate price – has declined sharply since early 2014 to just 23.66p per litre. When it costs farmers around 30p to produce each litre, it’s easy to see why they are annoyed.

The major milk processors have to balance their operations across the various markets they sell in and, as a consequence, pay dairy farmers an average price. Farmers will not get, and should not expect to get, the supermarket price for liquid milk. Some supermarkets – Tesco, Marks & Spencer, Sainsbury’s and Waitrose – have agreed direct contracts with dairy farmers that allow them to recover their production costs, but these only involve a small number of farms.

Retail supermarket prices for liquid milk are much higher than farm gate, at typically 55-60p per pint (£1.30 or so per litre), but there is no evidence that milk is being used as a “loss leader”. Four pints for 89p at Asda is probably as low as they can get, but the price spread is understandable, appropriate and market-justified; we can’t just hold supermarkets alone responsible. If there is a villain in this piece, it is the world market.

With too much supply and not enough demand, farmers have two options. Those near big cities can opt out of the globalised milk market through establishing farmer co-operatives to supply just the local area where they can possibly charge higher prices. Or they can seek high-value, niche markets such as yoghurts, farm-produced ice cream and organic milk.

One other way of dealing with supply-demand imbalances would be to bring back dairy quotas, at least at lower levels. The EU introduced quotas in 1984 to control milk production and eradicate butter mountains but they were abolished in April this year.

The problem currently facing the British dairy industry is that it is easy to produce milk in the UK’s green, wet and pleasant land, but it is very difficult to find profitable markets for 14 billion litres of the stuff. Until dairy farmers resolve this overproduction dilemma, many will continue to go out of business.

Uneconomic dairy farms, like uneconomic coal mines, must close down and the adjustment process is harsh and painful for farmers and miners alike. In today’s highly globalised world a more humane outcome is unlikely.

The Conversation

John Lingard, Associate, Centre for Rural Economy, Newcastle University

This article was originally published on The Conversation. Read the original article.

Time to get re-regulation back into Dairy Farming?

Bruce Muirhead, University of Waterloo

The Australian government’s intervention in the dairy crisis by offering concessional loans to struggling farmers has prompted suggestions that other types of regulation - such as a dairy floor price - might be needed.

The dairy industry was deregulated more than a decade ago; perhaps it’s time Australia looked to other countries for models to fix the system.

The current situation facing the Australian dairy industry is the same the world over. The European Union and the United States come to mind, as milk supply outweighs demand. But they provide assistance to their dairy farmers through subsidies or other support that helps to keep them viable.

Canada does not compete internationally in the dairy sector as it maintains a supply management system introduced in the early 1970s. Dairy is not subsidised, as government provides no support, and the price paid to farmers is negotiated among stakeholders.

When I explained this Canadian supply management model to Victoria dairy farmers, as part of my research earlier this year, they rejected the idea. However the current situation may cause some of them to reconsider this position.

While the Canadian model works for Canadian farmers, a supply managed system would be more difficult for those in Australia given that about 40% of Victorian dairy is exported and exports don’t happen with supply management. But Australia’s share of the global market is decreasing over time, despite the best efforts of Australian dairy organisations and farmers, and the number of farms continues to decline. Perhaps Australia will end up with a system resembling a supply managed one through market mechanisms.

I interviewed a total of 45 farmers and dairy stakeholders in Australia during February and March of this year, nearly half in Queensland and the remainder in Victoria and Tasmania. I was interested in how the Australian dairy model works, especially as it is cited by the business press in Canada as one that we should adopt given their dislike of Canada’s regulated system.

What is the supply management model? Briefly, it matches domestic demand with domestic supply and exports are non-existent. The system is based on quotas - for example a kilogram of milk solid costs C$25,000 in the province of Ontario where I live, and it represents about one cow’s worth of production. Producers need at least 50kg of milk solids to run a decently remunerative operation.

Stakeholders representing producers, consumers, processors, the restaurant association and others meet annually to determine price, not government. Included in this is a profit guarantee for farmers that allows them to make long-term decisions and maintain a middle class lifestyle while milking on average about 70 cows. It also means they are immune to this latest global crisis, and to future ones.

And if supermarkets decide to use milk as a loss leader, it is the deep-pocketed supermarket that takes the hit, not the farmer. The price paid to the latter is guaranteed by negotiation, which creates stability.

Clearly, this is not how it operates in Australia where the supermarkets, according to one Queensland dairy producer, “must bruise the farmers to give them a loss leader.” Nor is the price consumers pay for milk in Ontario out of line with that charged by Coles and Woolworths, the real regulators of Australian dairy. Southern Ontarians pay the equivalent of the infamous A$1.00 per litre – A$4.00 for Canada’s four litre container, and have done so for years.

I found in my research that Victoria’s dairy farmers are in favour of privatisation and deregulation. They talked a lot about efficiency and how they are among the world’s more efficient farmers, and Canadians must surely not be, given their system.

Perhaps this is true if efficiency is measured by getting the greatest amount of milk for the least input. But Australian dairy farmers fall behind by other parameters.

Ontario dairy farmers, for example, employ robotic technology at a much greater rate than their Victorian counterparts. New dairy barns are being put up all over the province and a majority of them install robots to do their milking. Ontario now has hundreds of farms using milking robots.

The situation in Victoria could well come to that of New Zealand’s, where cows may be culled and the survivor’s rations severely cut back, as farmers are unable to feed supplements in such an adverse economic climate.

In an interview, as part of my research, one New Zealand dairy farmer told me he was into “starvation mode” for his cows because of cost. He was feeding them with grass only and when that ran out, there was nothing else. He was certainly running an efficient farm, but at a significant cost to his own mental health and to that of his cows’ wellbeing and ability to provide milk.

One Victorian farmer told me that even before the announcement of cuts to the milk solids price, he and his colleagues “farmed at the margins". When prices are robust, so are farmer’s livelihoods, but when they collapse, as they always do in a commodity situation, so do their livelihoods.

This results in another vicious cycle of dairy farmers quitting the industry which leads to further instability. As another interviewee told me, following the cut:

“We will wait and see and hang on for dear life.”

Might the future of Victorian dairy be Queensland, where farmers suffered much of what their Victoria counterparts are now experiencing more than a decade ago after deregulation, and dairy is now a niche industry?

As one Queensland interviewee emphatically instructed me about Canada’s model:

“Don’t give away [the] regulated system!”

Now is the time for Victoria to consider the advice of this farmer and introduce more regulation.

The Conversation

Bruce Muirhead, Professor of History and the Associate Vice President, External Research , University of Waterloo

This article was originally published on The Conversation. Read the original article.

2016 Federal Budget - A Preview

Westpac expects the underlying budget deficit for 2016/17 which will be announced by the Federal Government on Budget night, May 3, will be $29bn. That is a near $5bn upgrade from the Government's December forecast, published in the Mid-Year Economic and Fiscal Outlook (MYEFO). Across the four years to 2018/19, the improvement is $17bn.

The economic environment is somewhat more favourable than anticipated. Real output growth has surprised to the high side in 2015/16. Commodity prices have also surprised, bouncing off historic lows, driving an upgrade of the terms of trade forecasts. In 2016/17 the terms of trade is set to swing from a major negative for national income to a small positive. Partially offsetting this: the currency has moved up from its lows; and general inflation pressures have weakened.

On the Government's forecasts for real GDP growth we expect just the one change, a 0.25% upgrade for 2015/16. That yields a profile of: 3.0%, 2.75%, 3.0% and 3.0%. The forecast for nominal GDP growth is upgraded by 0.25% in both 2015/16 and 2016/17 but downgraded by 0.25% in 2017/18, giving a profile of: 3.0%, 4.75%, 4.75% and 5.25%.

The iron ore price is expected to be revised higher from US$39/t fob in MYEFO to US$50/t (fob) for 2016/17 and US$46/t (fob) beyond that. This adds an estimated $7.8bn over the 3 years to 2018/19.

The budget impact from the improved economic backdrop, together with prospects for the 2015/16 deficit to be $1bn smaller than expected on lower expenditures, is $4.5bn in 2016/17 and $3bn a year thereafter, we estimate.

We anticipate that the balance of new policy measures, including the drawing down of the contingency reserve, as occurred in the May 2015 Budget, will be neutral for the budget in 2016/17 and improve the budget position by $2bn in 2017/18, increasing to a $5bn contribution in 2018/19.

The 2016 Budget is to focus on competition, innovation, investment and infrastructure. There will be tax cuts to boost investment and activity, as occurred in the 2015 Budget, funded by revenue integrity measures. A new infrastructure delivery agency is to be created, with private sector involvement. Any potential impact of the new infrastructure agency on government borrowing is unclear and has not been incorporated in our figuring.

The budget returns to balance in 2019/20, which now rolls into the four year forward estimate period. That is one year earlier than expected in MYEFO.

Net debt peaks at 17.9% of GDP in 2017/18, which is below the 18.5% peak forecast in MYEFO. In dollar terms, net debt climbs to $330bn in 2018/19, some $17bn below that in MYEFO.


Bill Evans

Westpac Economics


$AUD likely to resume downtrend

Introduction

After hitting an almost seven year low of $US0.6827 in January the Australian dollar has rebounded by 12% or so hitting a high of $US0.7680. The rebound begs the question as to what is driving it and more fundamentally whether the 38% decline from its 2011 high against the US dollar has now run its course. This note looks at the main issues and what it means for investors.

Why the rebound?

A classic aspect of investing is to be wary of the crowd. When investor sentiment and positioning in an asset reaches extremes it often takes only a slight change in the news to drive a big reversal in the asset’s price. And so it is with the Australian dollar. After its large fall to below $US0.70 big speculative short (or underweight) positions had built up. This coincided with a lot of talk about a “big short” in Australian property, banks and the $A. This can be seen in the next chart.

Source: Bloomberg, AMP Capital

And then over the last month or so the news for the Australian dollar has turned more positive with commodity prices bouncing back (from their recent lows oil is up 50%, copper is up 15% and iron ore is up 45%), the Fed sounding more dovish and delaying rate hikes which has pushed the $US down generally and Australian economic growth holding up well. The combination of a more dovish Fed and better Australian data has seen a widening in expected interest rate differentials between Australia and the US, which makes it relatively more attractive to park money in Australia. So with more positive news on Australian export earnings and the relative interest rate in favour of Australia, speculators and traders have closed their short positions and the Australian dollar has rebounded.

More broadly the rebound in the $A has been part of a return to favour by growth assets since January/February that has seen shares, commodities, corporate debt and growth sensitive currencies rebound as worries about a global recession receded. This is often referred to as “risk on”.

Will the rebound in the $A be sustained?

In the very short term the $A could still go higher yet as long positions in it are still not extreme and the Fed’s new found dovishness could linger. A rise to $US0.80 is possible. However, it’s premature to say that the $A has seen its lows and the trend is now up. In fact my view remains that the trend is still down. First, just as the long term upswing in the value of the $A from $US0.48 in 2001 saw multiple setbacks, including a 39% plunge in 2008, on its way to the 2011 high of $US1.10 the secular down trend that started in 2011 is likely to have several reversals too. There will always be short term/cyclical swings.

Second, the recent rally looks a bit like the 9% short covering rally that occurred in early 2014. After falling through parity in 2013 the $A hit a low of $US0.8660 in January 2014 by which time large short positions had been built up. These were then closed as the RBA saw it prudent to opt for an extended “period of stability” in interest rates and commodity prices bounced higher which pushed the $A up and left it stuck around $US0.94 for five months. Once short positions had reversed, commodity prices resumed their downswing and it looked like the RBA would have to cut rates again the $A resumed its downswing.

Third, fundamental drivers still point south for the $A:

  • Commodity prices - while the worst is probably behind us, commodity prices likely remain in a long term, or secular downswing thanks to a surge in supply after record investment in resources for everything from coal and iron ore to gas and slower global demand growth. As can be seen in the next chart raw material prices trace out roughly 10 year long term upswings followed by 10 to 20 year long term bear markets. This long term cycle largely reflects the long lags in supply adjustments.

    Source: Global Financial Data, Bloomberg, AMP Capital

    Plunging prices for commodities have resulted in a collapse in Australian export prices and hence our terms of trade and this weighs on the value of the $A. This is highlighted by the iron ore price which at the start of last decade was below $US20/tonne rising to over $US180/tonne in 2011 and is now running around $US55/tonne.
  • Interest rates – the interest rate differential in favour of Australia is likely to continue to narrow, making it relatively less attractive to park money in Australia as part of the so-called “carry trade”. While Fed hikes have paused recently in response to global growth worries, they are likely to resume at some point this year in line with the so-called “dot plot” of Fed officials interest rate expectations pointing to two 0.25% hikes this year.

    Meanwhile, although it’s a close call we remain of the view that the RBA will cut interest rates again in the months ahead: as mining investment continues to unwind; the contribution to growth from the housing sector via building activity and wealth effects starts to slow over the year ahead making it critical that $A sensitive sectors like tourism and education are able to fill the gap; to offset possible further out of cycle bank interest rate hikes; and as inflation remains at the low end of the target range. The strengthening $A also adds to the case for another rate cut.

A final critical driver of the Australian dollar is the US dollar itself – but it has become more ambiguous. The ascent of the US dollar from 2011 was a strong additional drag on the $A both directly and via its impact on commodity prices. However, it also added to concerns about the emerging world (as a rising $US makes it harder to service US dollar denominated loans raising the risk of some sort of financial crisis) and as a rising $US constrains US economic growth, doing part of the Fed’s job for it. Consequently, the sharp upwards pressure on the value of the $US may have run its course. But with the Fed still gradually tightening a sharp fall in the $US is unlikely either. Rather it’s likely to track sideways.

Source: Bloomberg, AMP Capital

$A likely to resume its downswing

So while the big picture outlook for the $US has turned neutral, the combination of soft commodity prices and the relative interest rate differential between Australia and the US set to narrow point to a resumption of the downtrend in the $A in the months ahead. How far it may fall is impossible to tell. One guide is via what is called purchasing power parity (PPP), according to which exchange rates should equilibrate the price of a basket of goods and services across countries. The next chart shows the $A/$US rate against where it would be if the rate had moved to equilibrate relative consumer price levels between the US and Australia since 1900.

Source: RBA, ABS, AMP Capital

Right now the $A is around fair value on this measure of $US0.75. But it can be seen from the chart that the $A rarely stays at the purchasing power parity level for long and is pushed to extremes above and below. Right now the commodity down cycle is likely to push the $A to overshoot fair value on the downside. In a way this could be seen as making up for the damage done to the economy during the period above parity. This is likely to take the $A towards $US0.60 on a 12 month horizon.

Implications for investors

There are a several implications for investors. First, the likely resumption of the downtrend in the $A highlights the case for Australian based investors to maintain a decent exposure to offshore assets that are not hedged back to Australian dollars (ie remain exposed to foreign currencies). Put simply, a declining $A boosts the value of an investment in offshore assets denominated in foreign currency one for one. This has been seen over the past five years to February where the fall in the value of the $A turned a 7.1% pa return from global shares measured in local currencies into a 12.9% pa return for Australian investors when measured in Australian dollars.

Second, having an exposure to foreign currency provides a useful hedge for Australian based investors in case we are wrong and the global growth outlook deteriorates significantly. The $A invariably falls (and foreign currencies rise) in response to weaker global growth.

Finally, the fall in the value of the $A to levels that offset or more than offset Australia’s relatively high cost levels is very positive for sectors that compete internationally including manufacturing, tourism, higher education, agriculture & miners. This in turn should continue to help the economy weather the mining downturn and is in turn positive for the Australian share market. Roughly speaking each 10% fall in the value of the $A boosts company earnings by 3%.


Shane Oliver

AMP Chief Economist

Crash calls for Australian Property - how valid are they?

To modify Benjamin Franklin, it seems that in Australia nothing can be said to be certain, except death, taxes and endless debate about property prices. Why is it so unaffordable? Are foreigners to blame? Is it a good investment? Is negative gearing the problem? Are property prices about to crash?

Worries about a property crash have been common since early last decade. In 2004, The Economist magazine described Australia as “America’s ugly sister” thanks in part to a “borrowing binge” and soaring property prices which had seen it become “another hotbed of irrational exuberance”. At the same time the OECD estimated Australian house prices were 51.8% overvalued. Since the GFC, predictions of an imminent property crash have become more common with talk that a property crash will also crash the banks and the economy.

Our view since around 2003 has been that overvaluation and high levels of household debt leave the housing market vulnerable. As such it could be seen as Australia’s Achilles heel. However, in the absence of a trigger it’s been hard to see a property crash as a base case. Not much has really changed. This note takes a look at the key issues and what it means for investors.

Overvalued, over loved and over indebted

The two basic problems with Australian housing are that it is expensive and household debt is high. Overvaluation is evident in numerous indicators:

  • According to the 2016 Demographia Housing Affordability Survey the median multiple of house prices in cities over 1 million people to household income is 6.4 times in Australia versus 3.7 in the US and 4.6 in the UK. In Sydney it’s 12.2 times and Melbourne is 9.7 times.
  • The ratios of house prices to incomes and rents are at the high end of OECD countries and have been since 2003.
  • Real house prices have been above trend since 2003.

Source: ABS, AMP Capital

The shift to overvaluation more than a decade ago went hand in hand with a surge in the ratio of household debt to income, which took Australia’s debt to income ratio from the low end of OECD countries to now being around the top.

Source: ABS, RBA, AMP Capital

Overvaluation and high household debt are central elements of claims that Australian house prices will crash. These concerns get magnified whenever there is a cyclical surge in prices as we have seen recently in Sydney and Melbourne.

But a crash seems elusive

However, given the regularity with which crash calls for Australian property have been made over the last decade and their failure to eventuate, it’s clear it’s not as simple as it looks.

First, the main reason for the persistent "overvaluation" of Australian home prices relative to other countries is constrained supply. Until recently Australia had a chronic under supply of over 100,000 dwellings, as can be seen in the next chart that tracks housing completions versus underlying demand. Completions are at record levels but they are just catching up with the undersupply of prior years.

Source: ABS, AMP Capital

Consistent with this, vacancy rates while rising are below past cycle highs. In fact, in Sydney they are still quite low.

Source: Real Estate Institute of Australia, AMP Capital

Secondly, Australia has not seen anything like the deterioration in lending standards other countries saw prior to the GFC. There has been no growth in so-called low doc and sub-prime loans which were central to the US housing crisis. In fact in recent years there has been a decline in low doc loans and a reduction in loans with high loan to valuation ratios. See the next chart. And much of the increase in debt has gone to older, wealthier Australians, who are better able to service their loans.

Source: APRA, AMP Capital

Third, and related to this, there are no significant signs of mortgage stress. Debt interest payments relative to income are low thanks to low interest rates. See the next chart.

Source: RBA, AMP Capital

By contrast in the US prior to the GFC interest rates were starting to rise. Yet in Australia bad debts and arrears are low. While new loan sizes have increased, Australians seem focussed on cutting their debt once they get it.

Finally, while some seem to think that because property prices in mining towns like Karatha are now crashing this is a sign that other cities will follow. This is non-sensensical. Property prices in mining towns surged thanks to a population influx that flowed from the mining boom. This is now reversing. Perth and Darwin are also being affected by this but to a less degree. By contrast the surge in property prices in cities like Sydney and Melbourne that occurred into early last decade predated the mining boom and their latest gains largely occurred because the end of the mining boom allowed lower interest rates.

The current state of play

Our assessment is that the boom in Sydney and Melbourne is slowing thanks in large part to APRA’s measures to slow lending to property investors. However, house price growth is likely to remain positive this year. Price growth is likely to remain negative in Perth and Darwin as the mining boom continues to unwind. Hobart & Adelaide are likely to see continued moderate property growth, but Brisbane may pick up a bit. Nationwide price falls are unlikely until the RBA starts to raise interest rates and this is unlikely before 2017. And then in the absence of a recession or rapid interest rate hikes price falls are more likely to be 5-10% as was seen in the 2009 and 2011 down cycles rather than anything worse.

Source: CoreLogic RP Data, AMP Capital

What to watch for a property crash?

To see a property crash – say a 20% average fall or more – we probably need to see one or more of the following:

  • A recession – much higher unemployment could clearly cause debt servicing problems. At this stage a recession looks unlikely though.
  • A surge in interest rates – but the RBA is not stupid; it knows households are now more sensitive to higher rates.
  • Property oversupply – this is a risk but would require the current construction boom to continue for several years.

Implications for investors

There are several implications for investors:

  • While housing has a long term role to play in investment portfolios it is looking somewhat less attractive as a medium term investment. It is expensive, offers very low income (rental) yields compared to all other assets except bank deposits and Government bonds and it’s vulnerable to possible changes to taxation arrangements around property.
  • There are pockets of value, eg in regional areas. You just have to look for them.
  • As Australians already have a high exposure to residential property (directly and via bank shares and property trusts), there is a case to maintain a decent exposure to say unhedged global shares because it could provide an offset if it turns out I am wrong and the Australian property market does have a crash.

Is the 5.6% jump in Private Health premiums justified?

Elizabeth Savage, University of Technology Sydney

Health Minister Sussan Ley today announced private health insurance premiums will increase by an average of 5.6% from April. This amounts to the average family paying about $300 more a year for an average policy.

This year’s increase is a little lower than increases of about 6% approved over the last two years.

The 2016 increases range from 3.8% for the Doctor’s Health Fund, to just under 9% for CUA health Fund. Increases for the largest funds, Medibank and BUPA, are just below the industry average. (Scroll to access the full list below).


Under the Private Health Insurance Act, the health minister must approve company requests for premium changes, unless she is satisfied that to do so would be contrary to the public interest.

After receiving the first round of applications, the minister requested on January 30 that health funds “resubmit lower applications for premium increases or provide any evidence of extenuating circumstances”. Twenty funds subsequently lowered their requests.

The minister’s request for funds to work with the health department to reduce premiums, while unusual, is not surprising. Since 1997, when the Howard government introduced the 30% health insurance premium rebate, the federal government is a significant stakeholder in the private health sector.

The annual cost of the premium rebate has grown markedly from about A$1 billion in 1998 to about A$6 billion currently.

In the 12 months to December 2015, the national regulator, the Australian Prudential Regulation Authority, reports that premium revenue increased by 6.9%, benefits paid by insurers by 6% and fund profits before tax by 7%.

Despite the small reduction in this year’s premium increase, the 2016 outcomes for the industry are unlikely to differ much from those of 2015.

What’s driving premium increases?

The major driver of premiums is the level of benefits paid to insured patients for hospital treatment and services covered by general insurance.

In 2015, total hospital benefits were A$13.58 billion, including A$2.13 billion for benefits to medical practitioners and A$1.95 billion for prostheses such as pacemakers, stents and artificial hips and knees.

Benefits for general cover (99% of which are for extras treatment such as dental, optical, chiropractic, natural therapies) totalled A$4.63 billion.


Hospital benefits have increased at a faster rate than extras. This is despite the share of the population with hospital cover remaining steady at around 46% to 47% over the past five years and very limited increase in the average age of the population with hospital cover.

Even though there has been a steady increase in the share of the population with general cover (from about 52% in 2010 to 56% in 2015) premium increases are being driven by hospital benefits, of which 14.4% are for prostheses.

Insurers could use higher benefits payments to justify premium increases if there was sufficient competition in the insurance sector to promote efficiency and lower costs of private treatment.

But the Australian industry is highly concentrated. The two largest insurers, Medibank and BUPA, have 56% of the market. This suggests that inefficiency is driving premium inflation, some of it arising from a poorly designed regulatory framework.

Benefits for prostheses

In 2015, insurers paid almost A$2 billion in hospital benefits for prostheses.

The insurance cost of prostheses was raised in a submission to the Harper Competition Policy Review from Applied Medical, a manufacturer of a clip applier used in laparoscopic surgery.

The submission argued that the minimum benefits set by the government regulator, the Prostheses Listing Authority, were far higher than both prices in comparable overseas countries and those paid by public sector hospitals in Australia:

Subject to the need to consult with stakeholders, there is sufficient power to implement reforms which would bring prostheses costs to the private health system down so that they would be comparable with prices paid in other countries – reducing prices by as much as 75%.

Applied Medical estimated that hospital benefits could be reduced by about A$600 million annually if excess benefits, currently shared between the manufacturer and the private hospitals, were eliminated.

The final report of the Harper Review, released in March 2015, recommended:

The regulation of prostheses should be examined to see if pricing and supply can be made more competitive, while maintaining the policy aims of the current prostheses arrangements.

Minister Ley has raised prostheses reform as a priority this year, noting that insurers pay $26,000 more for a pacemaker for a private patient than a public patient ($43,000 compared with $17,000).

What needs to be done?

According to an online government survey in November and December of 2015, the public is concerned about the affordability of health insurance and questions its value for money.

Despite premiums continuing to increase at a rate considerably above inflation, there is little evidence that people are responding by dropping their cover.

The Lifetime Health Policy, introduced the Howard government introduced in 2000, ensured that the penalties of doing so are too high if they wish to buy insurance at some time in the future. After the age of 31, the policy adds adds a 2% loading to the premium for every year of age over 30.

One way to keep premiums down is to address regulatory failures. Reforming the inflated prostheses benefits set by the government regulator and health minister in 2006 is in urgent need of attention.

Without such reforms, patients remain worse off, paying insurance premiums which increase every year. And the federal government is faced with an ever growing cost of the insurance rebate.

Another way is for government to rethink the incentives for insurers to pursue cost reductions by health providers that will lower insurance payouts and thereby lower premiums.

In the Australian system, insurers pay the providers agreed amounts and request approval from the minister for premium increases to cover increased benefit payouts. In other countries, insurers contract with specified health providers who compete both on quality and price for patients listed with the insurer.

Encouraging insurers to be more active could reduce premiums for consumers.

The Conversation

Elizabeth Savage, Professor of Health Economics, University of Technology Sydney

This article was originally published on The Conversation. Read the original article.

Government set to change Senate voting - bad news for 'micros'

Michelle Grattan, University of Canberra

The government is set to secure reforms to the Senate voting system that will squeeze out “micro”-players.

Immediately after the changes were announced by Prime Minister Malcolm Turnbull and Special Minister of State Mathias Cormann, the Greens welcomed the move and called on the ALP to support it.

While the Greens said they would scrutinise the legislation, which was introduced in the House of Representatives immediately after the announcement, they have had extensive negotiations with the government. Support from the Greens is all that is needed to get the measures through the Senate.

The changes would bring in optional preferential voting “above the line”, replacing the present group voting tickets. Voters would be advised to number at least six boxes in order of choice. But their vote would still be valid if they numbered only one box.

At present, people just mark one box but have no control over their preferences. Complicated deals over preferences have meant the election of candidates on tiny votes.

Almost all voters vote above the line.

In relation to below-the-line voting, the government proposes to reduce the number of informal votes by increasing the number of mistakes allowed from three to five, as long as 90% of the voting paper is filled in correctly.

Group and individual voting tickets will be abolished.

A restriction will be introduced to prevent individuals holding relevant official positions in multiple parties.

The changes also allow parties, if they wish, to have their logos on the ballot paper, to reduce confusion. At the last election the Liberals complained that many of their voters thought the Liberal Democratic Party (LDP) was the Liberal Party. The LDP got senator David Leyonhjelm elected in NSW.

Turnbull said there had been much criticism of the last Senate election. People were astonished to see senators elected on very small votes. Under the reforms every Australian who voted in the Senate “will determine where their vote goes. And that’s democracy”, he said.

If there is a double dissolution all or almost all micro-players would be immediately out. A normal election would make it nearly impossible for new micro-players, but the several elected in 2013 would still have more than half of their term remaining.

Amid speculation about a double dissolution, Turnbull said “nothing has changed”. He was working on the assumption that the election would be held at the normal time – which was August, September or October.

Turnbull said the government did not have a view on who would be electoral winners out of the change. He pointed out that the reform was recommended unanimously by the Joint Standing Committee on Electoral Matters.

That committee will now scrutinise the legislation, which the government wants passed by the time parliament rises for the autumn recess in mid-March. It will take the Electoral Commission about three months to make the necessary changes, which means they could be ready for either a normal election or a July double dissolution.

Greens leader Richard Di Natale said the Greens had been putting forward legislation over 12 years for Senate voting reform that ended backroom preference deals and put power back into the hands of voters.

“The only people who support the current system are the faceless men and factional operators who can wield power and influence in back rooms,” he said.

Independent senator Nick Xenophon, who won almost two quotas at the last election, supports Senate voting reform.

Labor, despite supporting reforms on the parliamentary committee, has since become sharply divided. Some factional heavyweights strongly oppose them, believing they would work to the Coalition’s advantage. Opposition Leader Bill Shorten reserved Labor’s position.

Motoring Enthusiast Party Senator Ricky Muir, elected in 2013 on about 0.5% of the Victorian Senate vote, tweeted his disapproval of Turnbull’s move.

Michelle Grattan, Professorial Fellow, University of Canberra

This article was originally published on The Conversation. Read the original article.

Australian Growth - State by State

The Australian Bureau of Statistics have released the annual State Accounts.

The state accounts provide annual estimates of output growth by state, Gross State Product.  Quarterly estimates are not available.

The accounts for the 2014/2015 financial year confirm that a growth transtion is underway.  The mining states of the north west, Qld and WA are slowing, while the southern states, Victoria, SA and Tasmania are improving.

WA, despite a loss of momentum, still managed to top the growth charts in 2014/2015 at 3.5%, moderating from 5.6%.  The two largest states came in next, with Victoria at 2.5%, accelerating from 1%, and NSW at 2.4%, rounding up from 2.3%.  Next were SA at 1.6%, rebounding from a soft 0.8%, and Tasmania, also at 1.6%, extending its recovery from 1.3%.  Qld tumbled from 2nd place to 6th place, with output growth of only 0.5%, slowing from 2.8%.

The maturing of the mining investment boom, as construction work on major gas and iron ore projects are progressively completed, was central to the loss of momentum in WA and Qld.  Across the south-east conditions benefitted from the significant easing of monetary conditions - with record low interest rates and a sharply lower currency.

South Australia

SA's economy bounced back, expanding by 1.6%, following a sulggish 0.8% gain in 2013/2014.  As with NSW and Victoria, the key service sectors were the growth engine (particularly retail, hospitality and communications) adding 0.6%, up from only a 0.1% contribution in the previous year.  Health, finance and real estate added 0.9%, up from 0.6%, while conditions were mixed elsewhere.

The outcome for 2014/2015 of 1.6% was only a touch shy of the 1.75% expected by the state government, ahead of an anticiapated rise of 2% in 2015/2016.

Victoria

The Victorian economy experienced a significant rebound following a couple of disappointing years.  Gross State Product grew by 2.5%, up from 1.0%, an outocme close to the state's long run average of 2.7% and  a little above the state government forecast of 2.25%.  The government expects growth of 2.5% in 2015/2016.

As in NSW, the key service industries strengthened, addinng 0.7%, up from 0.4%.  In addition, it was a good year for both construction (0.5%) and finance (0.4%), as the housing sector responded strongly to low interest rates and an expanding population.


Source:  Westpac Economics 24th November 2015

Will the promised splurge on infrastructure do any good?

by Michael Collins, Investment Commentator at Fidelity

Novmeber 2015

In 1919, a US lieutenant colonel helped lead an 81-strong convoy of vehicles across the US as part of a campaign by the military to highlight the need for better highways across the US. Sixty-two days after leaving Washington D.C., the procession reached San Francisco, having navigated dirt roads, improvised bridges and often no roads whatsoever along the 5,200-kilometre journey.[1]

Thirty-seven years later, this US solider was in a position to fulfil the convoy’s mission. The Federal-Aid Highway Act of 1956 ushered through by President Dwight D. Eisenhower still stands as the world’s biggest infrastructure project. More than US$800 billion (A$1.1 trillion) of today’s dollars was spent in the US to build 75,000 kilometres of highway, 55,500 bridges and nearly 15,000 interchanges. Moreover, the national highway system that bears Eisenhower's name is still prized for its economic, social and even military benefits.[2] 

Politicians across the world today often talk about leaving such an infrastructure legacy. For spending on public works is touted as a cure for today’s stagnation, more pointedly as a way to overcome the lack of business investment. Most ruling parties know they need to increase spending to spur growth and many, especially on the right side of politics, reflexively back an infrastructure splash as the best means to do that. The demand for broadband and the need to build or repair bridges, railways, highways, canals and water and sewerage pipes in the world’s biggest cities add further pressure on governments to spend money on public goods.

Infrastructure spending is hyped as an economic cure because its advocates claim that, done well, it boosts productivity, stimulates the economy, aids confidence, increases the quality of life and can help government finances, even if it adds to public debt. Few would argue with these advantages in theory. It’s the “done well” qualification that always proves hard to fulfil. If infrastructure investment does increase, expect lots of dubious, vote-buying and controversial, even corruption-tinged, projects – after all, the corruption watchdog Transparency International rates public-works contracts and construction the world’s most corrupt industry.[3] Expect much bickering about how to pay for the projects and warnings that governments are overloading on debt. These issues will serve to make contentious the economic benefits of infrastructure spending. There is one optimistic thought amid any hullabaloo about white elephants that may ease the public angst if governments do spend big on capital works.

Doing anything grand always generates some opposition, especially when it creates the natural monopolies that are most infrastructure projects. The Democrat-controlled House of Representatives rejected Eisenhower’s highway bill in 1955 because enough lawmakers didn’t want the highways paid for by selling bonds. (A petrol tax was the compromise.) Policymakers these days could surely embark on enough worthwhile public projects to make up for any duds. Not all countries, especially those in the emerging world, have lacked business investment in recent years, the main economic argument for the government to step in and spend on public works. Even if governments in the developed world stay idle on infrastructure, pent-up demand would probably see business investment recover soon enough for that’s how the business cycle works. That’s not the plan. The push is on across the world for governments to invest in infrastructure. It will be part of a strategy to boost productivity while restoring medium- to long-term government finances and taking pressure of monetary policy. Record low interest rates add to the case for public spending but don’t necessarily make it watertight.

Hesitant business

To make a rationale for abnormal levels of public investment – for governments need to do a routine amount under any economic conditions so their economies can function – the lack of private investment needs to be explained. Business investment in advanced economies has only averaged 20.7% of GDP since 2010 (having sunk to 19.5% in 2009) compared with 23.6% of output during the 1990s. An even more stark analysis is that the IMF estimates that private investment in the advanced world has declined by about 20% since the crisis began in 2007 compared with pre-crisis forecasts, a result that compares unfavourably with an average decline of only 10% after previous recessions.[4]

The overarching reason for sluggish business investment is weak economic activity. The US’ so-called Great Recession, Japan’s torpor and the depression in the eurozone have, in effect, created a downward spiral because businesses sensed a lack of demand for their goods and services and have refrained from expanding production. Uncertainty has played a role, too, especially in the eurozone where a sovereign-debt crisis has deterred business from chancing big projects. Other causes are tighter access to credit in countries where banking systems wobbled and higher interest rates in recent years for companies in bailed-out eurozone countries. The Reserve Bank of Australia in June offered the interesting notion that entrenched “hurdle rates” and quick returns are to blame; that businesses look for an expected capital return that, while well above the cost of capital, ignores the cost of capital and that they look for outlays to be recouped within a couple of years, which boosts implied rates of return. “As a consequence, the capital expenditure decisions of many Australian firms are not directly sensitive to interest rates,” the RBA said.[5] Whatever the cause, the decline in business investment is costly for it robs a society of its best chance to boost productivity and, consequently, lift long-term living standards.

If one accepts that weak economic activity is behind the lack of business investment then the economic case is strong for government stimulus. The question thus narrows as to whether investment infrastructure is a worthwhile form of fiscal prodding. The query can become ideological because it can be turned into an argument about the role, size and competence of government in a capitalist system.

Stagnation buster 

Better infrastructure is a pressing need in much of the developed world for much of what exists is in need of repair. Yet government spending on public works has stagnated or even fallen in many countries in recent years because lawmakers have prioritised more politically sensitive spending on education, health and welfare over public works when formulating budgets. Investment in budget-surplus Germany, for instance, has averaged just 19.4% of GDP in the past five years compared with 23.8% of output during the 1990s. Infrastructure, like military spending and foreign aid, are easy budget items to trim in prudent times.

Many analysts contend that governments are acting contrary to everyone’s self interest when they prune allocations to public works. Lawrence Summers, the former US Treasury secretary, sees that infrastructure projects are the best antidote to the so-called secular stagnation that has gripped developed economies. He and others argue that when joblessness is high, public works financed by borrowing can stimulate the economy without adding to government debt, whereas – and this is the key to his argument – such projects wouldn’t be stimulatory if they were to be paid for by higher taxes or cutbacks in other areas.

At the same time, the extra boost to the economy from a megaproject can help reduce government debt ratios when real interest rates are low. (A project with a conservative 6% return would boost government revenue by 1.5% of the amount invested, assuming extra income is taxed at 25%, which more than covers the real cost of borrowing at, say, 1%, he figures.) On top of that, government debt ratios would benefit from the extra tax from those employed on the venture and narrow even more if government were to encourage private investment or to use equity financing, tax subsidies or loan guarantees to catalyse a dollar of infrastructure investment at less than the cost of a dollar. “In a time of economic shortfall and inadequate public investment, there is for once a free lunch – a way for governments to strengthen both the economy and their own financial positions,” Summers says.[6]

A history of flops

If now’s the time to build the next Snowy Mountains Scheme or even another Sydney Opera House luxury-style project, what should people make of the useless infrastructure governments have built or the money lost on projects that never even get started? The Ord River Irrigation Scheme at the top of Western Australian that was finished in 1971 perhaps best symbolises Australia’s hopeless public-works project, and it’s one that came with environmental damage. It was commenced without proper assessment, funded for political reasons and has never become the food bowl its proponents envisaged. The more-recent National Broadband Network famously never had a cost-benefit analysis before being proposed by the ALP during the 2007 election campaign. Even a less-flashy version being completed by the coalition government looks like costing about 15 times the initial forecast price tag of $4 billion.[7] An estimated $1 billion has been squandered on Melbourne’s East West Link 18-kilometre freeway project without a scratch being made in the ground.

Such failed or controversial publically funded projects are found all over the world, best encapsulated by the putdown, “a bridge to nowhere”. Costs, risks and damaging side effects are usually underestimated in rigged feasibility studies, while revenue forecasts and any benefits are generally exaggerated. Amid all this dubious economics, any environmental harm is minimised. Yet the public interest is often overridden by vested interests. (At least the liberal democratic capital system, by limiting the reach of government, rules out disasters such as China’s Great Leap Forward of 1955-1961, an infrastructure drive of sorts that led to an estimated 40 million deaths.[8])

Even if a project is considered worthwhile, a political fight usually brews over how to pay for it. Higher taxes, more government borrowing, the sale of state assets or public-private alliances are the usual options. In practice (but not in theory where perfect efficiency is assumed), governments can make money out of partnerships. Government can always build something cheaper than the private sector because their borrowing costs are lower and they can fetch a good price if the project is operating successfully. Alas, private-public projects are unpopular because the public has been dudded by so many.

Depressingly for the pro-infrastructure crowd, the economic benefits of public projects are clouded. An IMF study looked at 24 infrastructure blasts since 1969 in 21 emerging countries and found that, rather than inspire a speedier economic growth, such splurges mostly lead to slumps. Either over-extended governments needed to cut back on spending to fix their finances or public spending suppressed private investment. “There is no robust evidence that the investment booms exerted a long-term positive impact on the level of GDP,” the paper found. It concluded by saying that any public-sector boom in coming years will only be beneficial “if governments do not behave as in the past and instead take analytical issues seriously and safeguard their decision process against interests that distort spending decisions”.[9]

If you think developed countries would do better, remember that investment in infrastructure has never revived Japan’s economy for long. But taxpayers can take one solace if they think billions will be wasted on public works. Even projects that cost money in an accounting sense generally have vastly understated immediate economic Keynesian benefits. Useless public investment still stimulates an economy. It’s better than no spending. But perhaps against all expectations, today’s politicians will prove to have the Eisenhower touch.

Financial information comes from Bloomberg unless stated otherwise.

Why scrapping the 1 child policy will do little to increase the Chinese population

Stuart Gietel-Basten, University of Oxford

China is scrapping its one-child policy and officially allowing all couples to have two children. While some may think this heralds an overnight switch, the reality is that it is far less dramatic. This is, in fact, merely the latest in an array of piecemeal national and local reforms implemented since 1984.

In fact the change is really a very pragmatic response to an unpopular policy that no longer made any sense. And much like the introduction of the policy in 1978, it will have little impact on the country’s population level.

The overwhelming narrative being presented now is that this is a step to help tackle population ageing and a declining workforce through increasing the birth rate – dealing with the “demographic time bomb”. According to Xinhua, the state news agency, “The change of policy is intended to balance population development and address the challenge of an ageing population.” The party line is that the policy played an essential part in controlling the country’s population and, hence, stimulating GDP growth per capita. It prevented “millions being born into poverty”, but is no longer needed.

Of course, many scholars have disputed this official view. When the one-child policy was introduced, fertility rates had already fallen drastically, though there was an apparent paradox that overall population growth rates were very high.

Pragmatic response

As well as being unnecessary, the policy has become unpopular because of the heavy-handed actions of some local family-planning politicians who, either through force or corruption, brought the implementation of the policy into ill repute. Indeed, the “social maintenance fees” collected for infringements of the one-child policy were often zealously enforced in order to plug local budget shortfalls. In this sense, you could go as far as seeing the policy change as an indirect result of President Xi’s anti-corruption drive.

Countless studies – as well as the experience of previous policy relaxations – have shown that the likely long-term impact of any reform would be small. Couples who are already eligible to have two children in urban areas, and also increasingly in rural areas, are choosing to have one. This means that the likely impact on overall fertility may be low. In this context, one could see the scrapping of the one-child policy as being a practical, pragmatic response to deal with an increasingly unpopular policy, safe in the knowledge that the long-term implications are likely to be minimal.

Fertility in China Data: UN Department of Economic and Social Affairs

This is not to say, however, that the policy change is unimportant. Far from it. We must not forget that for many hundreds of thousands of couples, the change in policy will allow them to fulfil their dream of having a second child.

In the short term, then, there is almost certainly going to be a mini baby boom. In some poorer provinces which have had rather stricter regulations, such as Sichuan, the baby boom may even be quite pronounced. (However, it is likely that an increase in the total fertility rate would have occurred anyway because of what demographers call the “tempo effect”, where postponement of births among one generation leads to an artificially low total fertility rate.) As with anything in China, its sheer size will mean that the numbers will be striking. This will almost certainly lead to some pressures on public services in the future.

Chinese politics

The gradual move to a two-child policy is very reflective of the way policy is designed and changed in China. Scrapping the policy completely was not an option. This would have indicated that the policy was, in some ways, “wrong”.

Plus, one must not underestimate the size of the family planning bureaucracy. In 2005, it was estimated that that over half a million staff were directed involved in family planning policy at the township level and above, added to 1.2m village administrators and 6m “group leaders”. Effectively disbanding this overnight would have led to chaos.

But the fact that a change occurred indicates that major further change might lie ahead. Although it sounds counter-intuitive, after 35 years of strict anti-natalist policies, my colleague Quanbao Jiang and I recently argued that a switch to encouraging more children was not inconceivable, with China following the example of its low fertility neighbours in South Korea, Taiwan, Singapore and so on. Indeed, examples already exist of family planning officials in some Chinese provinces encouraging eligible couples to have a second child. Under these circumstances the family planning apparatus could play a critical role after performing a seemingly unlikely ideological shift.

Finally, questions will undoubtedly be asked about the legacy of the one-child policy. While its likely role in driving down fertility has probably been overstated, its role in shaping the highly skewed ratio of boys born compared to girls is widely considered to have been significant. In 2005 there were 32m more men under the age of 20 than women in China.

In my view, we will only really tell some 10-20 years in the future when we will be able to see how fertility in China develops. It may well be that the policy could have been too successful if it transpires that fertility remains stubbornly low. What is the likely psychological impact of 35 years of constant messaging extolling the benefits of one-child families? And how is that internalised? We shall see.

Looking elsewhere in Asia, though, the Chinese government may find that it is much easier to “encourage” people to have fewer children than to have more.

The Conversation

Stuart Gietel-Basten, Associate Professor of Social Policy, University of Oxford

This article was originally published on The Conversation. Read the original article.

2015 Federal Budget - Will I lose the Age Pension?

Budget brief: will I lose my age pension?

Rafal Chomik, UNSW Australia Business School

The Conversation’s Budget briefs series aims to answer reader questions about the 2015 federal budget.

The 2015 budget confirms pre-budget announcements that the government is committed to reducing the cost of the age pension, but will now do so more fairly than it had intended in last year’s budget.

Indexation plans dumped

The government had previously wanted to link the annual increase of the age pension to CPI instead of wages. Since prices grow more slowly than wages, this would have affected negatively anyone expecting to receive the pension in future.

Crucially, that policy would have lowered the safety net for those with the lowest incomes, halving its value relative to wages in the next forty years. Of the different options to reduce pension costs, this was the most inequitable. Thanks to Senate opposition it has now been abandoned. The freeze on eligibility thresholds relating to the pension will also be abandoned.

Changes to means-testing

The new proposal, to start in 2017, is to make the pension more targeted by tightening the asset test, particularly for home-owners.

As with any means-tested benefit, there are three parts: maximum benefit (i.e. the full pension), the amount of assets you can have before the pension is reduced (i.e. the asset “free area”), and the rate at which the pension is reduced as you have more assets (i.e. the taper). Income is tested separately.

The previous policy would have cut the maximum. The new proposal is to extend the free area, but to make the taper on extra assets more aggressive (see illustration) – a measure originally proposed by the Australian Council of Social Service (ACOSS).

The family home is still not counted as an asset. But as this graphic shows, people who own their own home will be affected differently to those who do not because the free area increases much more for non-home-owners than for home-owners.

Asset test changes for pensioners Data from DSS, Author provided

Who will be affected by the new means test?

You will be affected if your (non-home) assets are within the green or red asset ranges, which differ depending on relationship status and housing tenure. One consolation: the Treasurer has promised that “anyone who currently has a Pensioner Concession Card will continue to receive a concession card that provides the same benefits.”

The vast majority of older people will see no change. Those gaining and losing are part-pensioners. The Government estimates that 170,000 with modest savings are expected to gain some age pension and about 330,000 part-pensioners with more assets will lose at least some of their entitlement.

For example, older couples who own their home and have other assets between about A$800,000 and A$1.2 million are expected to lose their part-pension altogether.

Of the $2.4 billion savings to the budget created by these changes, almost the entirety is borne by changes affecting better-off home owners.

So the measure takes a step toward redressing the inequality of excluding the family home from the asset test, where someone who used their savings to buy a house is favoured over someone who uses theirs to pay rent.

The ideal policy would include the family home beyond a certain level and make better use of the Pension Loans Scheme, under which pensioners can get the age pension and eventually pay it back from the equity of their home.

While not saving as much as the previous indexation policy, the effect of a tougher asset test will build over time as Australians accumulate more superannuation savings. In future, more Australians will have assets that will reduce their age pension.

Either way, Australia would be expected to continue to spend very little on public pensions compared to most OECD countries.

Fragility of retirement incomes

The proposed policy is a fairer alternative to the indexation changes proposed in last year’s budget. That such indexation changes had any currency at all points to the fragility of the retirement income system when policy-makers focus only on sustainability. Issues remain, but at last both sustainability and adequacy are being considered.


Read more of The Conversation’s Federal Budget 2015 coverage.

Rafal Chomik is Senior Research Fellow, ARC Centre of Excellence in Population Ageing Research, UNSW at UNSW Australia Business School.

This article was originally published on The Conversation. Read the original article.

2015 Federal Budget Winners and Losers - Infographic

INFOGRAPHIC: The budget winners and losers

Charis Palmer, The Conversation and Emil Jeyaratnam, The Conversation

Charis Palmer is Deputy Business Editor at The Conversation.
Emil Jeyaratnam is Multimedia Editor at The Conversation.

This article was originally published on The Conversation. Read the original article.

Intergenerational Report - How Australia will change by 2055

The Government recently released its Intergenerational report which occurs once every 5 years.  The report is designed to provide Government with a basis in which to formulate long term policy (one must be careful not to laugh out loud at this point).

One of the glaring aspects of this report revolves around the ageing of Australia's population and here we provide some of the charts contained in the Intergenerational Report that highlight this ageing profile.

First the good news, which is on average we are going to be living longer.

Some key points from this table are that males born now can expect to reach 91.5 years old, but in 40 years they should expect to live until over age 95.  From a retirement perspective, those men who reach the retirement age of 60 currently can expect to live for a further 26.4 years (29 years for women), but in 40 years time it is expected that a 60 year old male will have over 31 years in retirement (over 33 years for women).

This tells us that people are going to have to save more for retirement as they are likely to be living longer in retirement.  Joint replacements are going to be in huge demand as the body will be required to last longer than at anytime in modern history. Divorce rates may increase as those who reach retirement will have over 30 years to live whereas in 1975, their retirement years were likely to be almost half, resulting in people staying together unhappily because 'there's not much time left anyway'.

The proportion of the population of those over age 65 is going to materially increase which can be seen in the next chart, and of particular interest (from a medical expense perspective) is the growing band of over 85 year olds.


From a different viewpoint, the future number of people living beyond 100 years is going to put pressure on the Royal Family and our politicians to recognise 100th birthdays as the number of centenarians is forecast to grow from under 5,000 today to almost 40,000 by 2055.  Perhaps 100 will be the new 80?

Finally, and one of the most hard hitting chart is the one that shows how many people of working age 15-64 will exist to support those over the age of 65.  In 1975 there were 7.3 people aged between 15-64 (assumingly paying taxes and working) to support 1 person over the age of 65 (who had a relatively short life expectancy by today's standard).

In 2025 that number will fall to 3.7 people aged between 15-64 supporting one person over the age of 65.

It is forecast that by 2055, the number of working people will fall to 2.7 persons for every person over the age of 65.

This is critical as the level of Government spending per person is at its peak for those over age 65, as it allocates money for age pension payments and also for medical expenditure. So Government spending is potentially in for a triple whammy in that there is forecast to be

1. a higher proportion of the population over 65 which contribute less tax but cost more,

2. those over age 65 are forecast to live longer, so not only do they cost the Government more, but will cost more for longer

3. the number of people in the workforce compared to those retired is forecast to drop dramatically - and those working are likely to be unhappy if taxes rise to support the retiree population.

You will also note from the chart below, that spending on children is also high, although not as high as those over 65, as Government spending comes in the form of education costs (largely).


Ablert Einsten's definition of insanity was to "keep doing the same thing over and over, and expect a different result".  We would argue that many government policies in the area of healthcare, taxation and welfare were structured decades ago, and if Australia continues to do the same things over and over in light of the population changes that are forecast, then we are insane.

Government policy is going to have to change to meet the demands of the changing nature of Australia's population.

Investors will need to consider this, particularly when investing in businesses that are partly funded by Government (read healthcare) as government priorities and spending ability will most certainly change over time. 

Investors should also turn their mind toward some of the other effects of an ageing population with respect to demand for things that retirees seek such as travel, healthcare and demand for financial services.  There is also very likely an impact on the residential property market when retirees look to downsize their houses.

We encourage readers to look at the intergenerational report, not that we expect much in the way of action from the current political leaders in the short term, (from all sides of politics), but at some stage Australia is going to have to position itself for these changes.


RBA February minutes - more rate cuts likely

The minutes of the Monetary Policy meeting of the Reserve Bank Board for February provide further insight into the Board’s thinking behind the decision to cut rates. This complements the Statement on Monetary Policy (SoMP) and the Governor’s testimony to the House of Representatives Standing Committee on Economics.

This is a difficult document to write given that the case needs to be made for the rate cut but most readers will be much more interested in the forward guidance.

The most important forward guidance which the Bank has delivered so far has been to assume “market pricing” for the interest rate outlook in its forecasts for the SoMP. At that time the market had priced in a further 25bp cut by May – by adopting that pricing it was implied that the Bank fully expected to cut rates again and certainly by May.

With the announcement that Australia’s unemployment rate had jumped from 6.1% to 6.4% in January, markets moved to aggressively embrace prospects for a cut by March.

A key issue is whether the Bank sees that adverse development as reason to further downgrade its already pessimistic outlook for the labour market or is inclined to dismiss it as “one month” volatility. Certainly it was a shocking move and one that , at least, would confirm their concern with the labour market.

Last week in writing on the Westpac-Melbourne Institute Index of Consumer Sentiment in February we noted: “For now, we are comfortable to maintain our original call [made on December 4] that the Bank would cut in both February and March. However we recognise that a perfectly respectable case can be made for the Bank to pause for a month or two to assess developments in the housing market”.

This observation is further supported in the minutes with the use of the sentence ( which first appeared in the SoMP) : “Given the large increases in housing prices in some cities and ongoing strength in lending to investors in housing assets members also agreed that developments in the housing market would bear careful monitoring”.

On the other hand , the Governor gave a balanced view on the housing market in his recent parliamentary testimony,” Price rises in Sydney are very strong, and they are pretty solid in Melbourne. On the other hand they are much more mixed elsewhere. Excluding Sydney, the rise for Australia as a whole over the past year was about 5 per cent. That is a healthy pace but not alarming.”

The sense of the Bank waiting a month or two for the follow-up cut is further strengthened by the following sentence in the minutes: “In deciding the timing of such a change members assessed arguments for acting at this meeting or at the following meeting. On balance, they judged that moving at this meeting which offered the opportunity of early additional communication in the forthcoming Statement on Monetary Policy was the preferred course.” This could, but not necessarily should, be interpreted that, at the time of the meeting, the board wanted one or the other but not both months.

“Communication” was always our argument for beginning the easing cycle in February rather than waiting for March.

Given that we have held the” February to be followed by March” call since December 4, on balance, we still see that as the best policy and the most likely outcome.

However, as noted above, waiting for a month or two would not come as a significant surprise.

Other incentives to wait, if the Bank is uncertain, would be to assess momentum in the December quarter with the national accounts that will be released on the day after the March meeting.

A major cost in delaying the next move is that the Australian dollar might start responding to a benign rates outlook. Note that the AUD has already traded back up to near USD 0.78 , its level prior to the February rate cut.

Commentary in the minutes pointed out that markets had, at the time, priced the Fed’s first rate hike back to year’s end whereas the governor in his testimony predicted,” in a few months from now”. This updated view on the FED might encourage the Bank to wait on the assumption that further downward pressure will exerted on the AUD. However, that adjustment should already have happened given the strong conviction in markets now that the FED is readying to move in June.

The key point is that the reasons given by the Bank in its recent communications , including the minutes, justify more than one move in total .; “ restrained pace of wage increases;”; “ low rates of inflation likely to be sustained”;” a lower exchange rate was likely to be needed” ;”fewer indications of near term strengthening in growth than previous forecasts would have implied” ;”unemployment rate likely to peak a little ( and later) than in the previous forecast”.

Indeed the risks are much more skewed to more than two moves in total rather than no more moves at all.

Certainly international investors see Australia’s rate structure as being far too high even with a cash rate of 2.25%.

Conclusion

These minutes , on balance, cast more doubt on a follow up move in March. While a March move to follow up February has been our core call since December 4 we can see that “ a respectable case can be made for the Bank to pause for a month or two “ but a second cut still seems extremely likely.

For now, we maintain our original call , particularly watching the AUD over the course of the next few weeks. It is our view that the Bank has considerable scope to ease further and the best policy is to maintain downward pressure on the AUD. The somewhat uncertain outlook for rates which is implied in these minutes might prove to be counter-productive in delivering the Bank it’s likely USD 0.75 target.

That may become apparent over the course of the next few weeks


Bill Evans

Chief Economist Westpac

Australian retailers and property trusts at risk

Andrew Fleming, Deputy Head of Australian Equities at Schroders says Australian retailers and property trusts are massively over-investing in physical shopping centres and under-investing in online channels when compared to their US counterparts (see chart). Fleming says this over-investment “increases the operating leverage pretty materially for both the retailer and for the property trusts that tend to own most of this space. Australian retailers are effectively betting that the US online experience isn’t replicated here. To us they’re big risks. We think it’s likely that ultimately that US experience in terms of online distribution is replicated here and that secondly the risk that they’re stranded assets in shopping centres is much higher than perhaps is countenanced with current valuations.”


Australian Margin Lending - indicator of risk appetite

With the Global Financial Crisis now 6 - 7 years behind us (depending on your view of when it commenced), Australian Consumer Sentiment has experienced its longest poor reading since the GFC.

So too the surveys of the best place to invest show Australian's unwillingness to take on risk through the share market.

Margin Lending, which are loans secured against shares, to leverage up a share market investment are another measure of the investors appetite to take on risk.  On a quarterly basis, the Reserve Bank publish the outstanding liabilities in margin loans.  You can clearly see that since the GFC, investors have continued to pay down margin debt, and virtually at no time since then has the value of margin debt increased since the crisis.

This would indicate that despite the financial markets showing good returns since 2012, investors animal spirits have yet to be rekindled.   Certainly experience in the US appears to indicate that increasing margin debt is correlated to rising share prices.  This will be an interesting aspect to watch for in Australia.

Source:  Reserve Bank Statistics - September 2014


This information is of a general nature only and neither represents nor is intended to be personal advice on any particular matter. We strongly suggest that no person should act specifically on the basis of the information contained herein, but should obtain appropriate professional advice based upon their own personal circumstances including personal financial advice from a licensed financial adviser and legal advice. Fortnum Private Wealth Pty Ltd ABN 54 139 889 535 AFSL 357306

Global gyrations and the $AUD

Key points 

  • After recent sharp falls the $A may see a short-term bounce, but the broad trend is likely to remain down against the $US reflecting a rising $US generally, a secular downswing in commodity prices, overvaluation in terms of relative prices and monetary tightening in the US relative to Australia.
  • So while the $A may consolidate into year end, it's expected to see another leg down next year taking it to around $US0.80.
  • The downtrend in the $A is good news for the local economy and share market (via a boost to earnings), but along with the downtrend in commodity prices highlights the case for global investments in foreign currencies. 

Introduction

The past month has seen a sharp fall in the value of the Australian dollar from around $US0.94 to a low of near $US0.86. While there will be short term gyrations, the broad trend in the $A likely remains down. This is part of a bigger global shift involving a stronger $US.

A secular upswing in the $US

Not only has the Australian dollar fallen sharply against the $US recently but so too have currencies such as the Euro and Yen. The chart below shows the value of the $US against a trade weighted basket of major currencies. 

 
Source: Thomson Reuters, AMP Capital

The $US has been tracing out a broad bottom since 2008. This is likely part of a broader long term or secular pattern:

  • During the second half of the 1990s the $US surged in value as the US was seen as a global growth and innovation leader.
  • During last decade from 2002 the $US traced out a broad decline as emerging market countries were much stronger.
  • But since the GFC the $US seems to be bottoming. Our assessment is that the secular downtrend in the $US since 2002 is now over and that it will now trend higher.

Because the US was proactive in dealing with the GFC its economy is now on a sounder footing globally and, like in the 1990s, it’s becoming something of a growth locomotive again:

  • The Fed will soon end its quantitative easing program and may start to raise interest rates next year.
  • But there is no end in sight for the Bank of Japan's bigger money printing program and the European Central Bank is about to embark on its own QE program this month. Neither is even contemplating raising interest rates.
  • While China is still strong its pace of growth has slowed with its own structural issues and pressure on the People's Bank of China to ease monetary policy. What's more the bulk of the rise in the Renminbi is likely behind us.
  • The emerging world is now beset by various structural problems which will possibly constrain their growth.

All of this points to a longer term upswing in the $US. This has a number of implications including less pressure on the Fed to raise rates as a rising $US is a de-facto monetary tightening (so lower US interest rates for even longer) and downwards pressure on commodity prices. In many ways it looks like we could be seeing a re-run of the second half of the 1990s which saw the US as the world's locomotive, a strong $US, weak commodity prices, benign inflation, relatively low interest rates and strong gains in US shares

A secular downswing in commodity prices

Just as the $US appears to be embarking on a long term upswing, commodity prices look to be in a long term down swing. In fact they are related as there are two drivers of the trend in commodity prices:

  • Supply and demand. Last decade demand for industrial commodities was surging led by industrialisation in China as supply (after years of commodity weakness) struggled to catch up. Now it’s the other way around as demand growth in China while still strong has slowed (accentuated by a cyclical downturn in property related demand) and supply is surging after record investment in in sources for everything from coal and iron ore to gas.
  • The value of the $US. Since commodities are priced in US dollars they move with it. They rose last decade when the $US was in decline and are now heading down as the $US is on the way up.

As can be seen in the next chart raw material prices trace out roughly 10 year long term upswings followed by 10 to 20 year long term bear markets. After an upswing last decade, they now look to be embarking on a secular downtrend.


Source: Global Financial Data, Bloomberg, AMP Capital

..and a secular downswing in the $A

Against this backdrop the big picture outlook for the $A is not flash. First, it's best to start with what economists call purchasing power parity, according to which exchange rates should equilibrate the price of a basket of goods and services across countries. A guide to this is shown below which shows the $A/$US rate (against where it would be if the rate had moved to equilibrate relative consumer price levels between the US and Australia since 1900. 


Source: RBA, ABS, AMP Capital

Purchasing power parity doesn’t work for extended periods. But, it does provide a guide to where exchange rates are headed over long periods of time. Right now on this measure the $A is still 15-20% overvalued, with fair value around $US0.75. This also lines up with anecdotes of high prices and labour costs in Australia compared to other countries. 

Second, as already noted, commodity prices are in a secular downswing. This is highlighted by the iron ore price which a decade ago was around $US20/tonne rose to $US180/tonne in 2011 and has since fallen back to around $US80/tonne. 


Source: Bloomberg, AMP Capital

Third, while Australian interest rates are still above those in the US and elsewhere the gap has narrowed. Moreover the Fed in the US is soon to end its monetary stimulus program and is likely to start raising interest rates well ahead of the RBA. 

Fourthly, perceptions of global investors about the $A appear to be changing. Over much of the last decade it was positive reflecting Australia’s favourable fundamentals tied to growth in the emerging world and more latterly as an AAA rated safe haven. Now there is a bit more wariness as emerging markets have gone out of favour and if Australia fails to get its budget deficit under control (with Senate blockages and the fall in the iron ore price likely to result in another deterioration in the next MYEFO budget outlook due later this year) foreign perceptions could deteriorate further.

Finally, as already discussed the trend in the $US is likely to be up.

In the short term, the Australian dollar has fallen a bit too far too fast (just as the $US has risen too far to fast), so a short covering bounce could well emerge over the next month or so. Indeed the $A seems to be finding support around $US0.8640. 

However, for the reasons noted above the broad trend in the $A is likely to remain down. I remain of the view that it will fall to around $US0.80 in the next year or so as the Fed eventually starts to raise interest rates, with the risk of an overshoot on the downside. 

Of course it's worth noting that the fall in the $A on a trade weighted basis won’t be as pronounced as against the $US as major currencies like the Yen and Euro are also likely to fall against the $US.

Implications for investors

There are a several implications for investors. 

First, the fall in the $A back towards more fundamentally justified levels is good for the Australian economy and ultimately the local share market. When the $A is in free-fall it is often bad news for the Australian share market as foreign investors retreat to the sidelines for fear of losing more of their money. But after a while the lower $A will become a source of support for the market as it flows through to upwards revisions to earnings expectations. A rough rule of thumb is that each 10% fall in the value of the $A boosts company earnings by 3%. Providing the downtrend in the $A remains gradual the negative impact from the boost to inflation flowing from higher import prices should remain modest.

Second, and perhaps more significantly, the outlook for a continuing downtrend in the value of the Australian dollar highlights the case for Australian based investors to have a relatively greater exposure to offshore assets that are not hedged back to Australian dollars (ie remain exposed to foreign currencies) than was the case say a decade ago when the $A was in a strong rising trend. Put simply, a declining $A boosts the value of an investment in offshore asset denominated in foreign currency 1 for 1. Eg a 10% fall in the value of the $A will boost a foreign share portfolio by 10% in value in Australian dollar terms. 

Finally, the longer term downtrend in commodity prices also works in favour of having a relatively greater exposure to traditional global shares as the US, Europe and Japan are commodity users and tend to benefit from softer commodity prices whereas it’s a headwind for the Australian economy. 

Important note: While every care has been taken in the preparation of this document, AMP Capital Investors Limited (ABN 59 001 777 591, AFSL 232497) and AMP Capital Funds Management Limited (ABN 15 159 557 721, AFSL 426455) make no representations or warranties as to the accuracy or completeness of any statement in it including, without limitation, any forecasts. Past performance is not a reliable indicator of future performance. This document has been prepared for the purpose of providing general information, without taking account of any particular investor’s objectives, financial situation or needs. An investor should, before making any investment decisions, consider the appropriateness of the information in this document, and seek professional advice, having regard to the investor’s objectives, financial situation and needs. This document is solely for the use of the party to whom it is provided. 

Dr Shane Oliver
Head of Investment Strategy and Chief Economist
AMP Capital

- See more at: http://media.amp.com.au/phoenix.zhtml?c=219073&p=irol-oliverArticle&ID=1977737#sthash.cA0gY2CL.dpuf

Australian Consumer Sentiment Dives

Consumer Sentiment falls significantly

The Westpac Melbourne Institute Index of Consumer Sentiment fell by 4.6% in September from 98.5 in August to 94.0 in September.

This is a surprising and disappointing result. Following the 6.8% plunge in the Index in the aftermath of the Commonwealth Budget in May the Index had stabilised and was gaining ground. From June to August the Index had lifted by 5.9% to find it only 1.3% below the pre-Budget level. The Index is now 5.8% below the pre- Budget level and only 1.1% above the post-Budget print.

In effect most of the steady recovery we had seen in the Index over the last three months has been eroded.

Every quarter we survey respondents’ recall of major news items. In June, following the release of the Commonwealth Budget, 73.8% of respondents recalled news items about ‘Budget and taxation’. That was a significantly higher percentage than for any other categories of news items, the next highest being ‘economic conditions’ (42.7%); ‘employment’ (22.2%); and ‘interest rates’ (16%).

For September ‘Budget and taxation’ continues to dominate. The significant topics recalled in September are: ‘Budget and taxation’ (62.7%); ‘economic conditions’ (53%); ‘employment’ (29.5%); and ‘interest rates’ (18.1%).

We also survey whether respondents assess the news heard as being favourable or unfavourable. All four topics were assessed as unfavourable although there were some marginal improvements in ‘Budget and taxation’ and ‘employment’. There was a marginal deterioration in ‘economic conditions’ and assessments of news on ‘interest rates’ were steady.

The proportion of respondents recalling ‘Budget and taxation’ issues is the second highest since the survey was introduced in mid-70s. The highest was the June reading and this compares with other high readings of 56.3% in June 2000 (associated with the introduction of the GST) and 55.2% in June 2010 (associated with the announcement of the mining tax). On both those occasions ‘news recall’ had fallen away significantly by the following quarter, to 26.7% and 30.5% respectively.

A reasonable summary from the ‘news heard’ / ‘news recall’ series is that households are a little more comfortable with the Budget but it continues to dominate their thinking and they remain on edge. Furthermore, they are still quite concerned about the domestic economy and the labour market with these concerns having deteriorated further since June.

Four of the five components of the Index fell in September.

One component, the sub-index tracking expectations for ‘family finances over the next 12 months’ was steady. The sub-index tracking assessments of ‘family finances compared to a year ago’ fell by 4.9%. There was a sharp deterioration in respondents’ assessments of the economic outlook. The sub-indexes tracking views on “economic conditions over the next 12 months” and “economic conditions over the next 5 years” fell by 8.4% and 9.2% respectively. The sub-index tracking assessments of ‘whether now is a good time to buy a major household item’ fell by 1.9%.

Consumer Sentiment Sept 14Of most concern here is the five year economic outlook. This component is typically much more stable than the 1 year outlook but the print in September is the lowest for 16 years. It is down 28.6% on its level from a year ago. Concerns around the medium term outlook are likely to make households more cautious. Logically, such concerns indicate that households expect any current economic weakness to be sustained for a considerable period.

The ‘news heard’ indexes indicated that respondents remain nervous around the labour market. These concerns were emphasised by the 2.1% increase in the Westpac–Melbourne Institute Unemployment Expectations Index (recall that a rise in the Index shows heightened concerns around the employment outlook). Fortunately, the Index is still 2.0% below its average for the first half of 2014 but there appears to be no sign of any sustained improvement in respondents’ outlook for the labour market.

Households continue to expect house prices to keep rising. The Westpac–Melbourne Institute House Price Expectations Index rose by 1.9% to be 25.5% above the level in July 2012 and 7.4% higher than July 2013.

However, there was an 8.2% fall in the index tracking assessments of ‘time to buy a dwelling’. This index is now 23.2% below its peak level in September last year. Clearly, households are unnerved by rising prices, surmising that affordability issues are constraining the attractiveness of buying a house. As we saw in the recent housing finance statistics, the momentum in the housing markets is clearly moving towards investors who are motivated by prospective price gains and rental yields and less affected by affordability considerations.

What does this mean for investors?

We remain of the view that investors should be cautious about investing in income streams leveraged to discretionary consumer spending.  This news should also put some pressure on the $AUD, so we are favouring investments that benefit from a falling $AUD.

For those who also believe in 'going against the herd' as recommended by Warren Buffett - there are some interesting insights about where Australians are 'herding' their investments at the moment.

This information is of a general nature only and neither represents nor is intended to be personal advice on any particular matter. We strongly suggest that no person should act specifically on the basis of the information contained herein, but should obtain appropriate professional advice based upon their own personal circumstances including personal financial advice from a licensed financial adviser and legal advice. Fortnum Private Wealth Pty Ltd ABN 54 139 889 535 AFSL 357306

Use of Cash in Australia

The Reserve Bank of Australia recently published the results of a survey in 2013 reflecting on the use of cash in the Australian economy.

Here are a couple of the key charts from the survey.  


This chart shows the percentage of transactions where cash was used, for varying transaction amounts.

The blue bar shows the results from 2007, yellow bar shows 2010 results and the green bar shows the latest results in 2013.

It is clear from looking at this chart, that cash is the dominant payment method for transactions $0-$20, although less dominant than 6 years ago.

What is most interesting is that for transactions greater than $100 - cash is used only 13% of the time.


The next chart shows the share of transactions in dollar value, where cash was used to pay.


This shows that cash as a payment method has declined dramatically since 2007 and that cards and internet/phone payments now account for over 70% of transactions.


The final chart shows the share of payments by age group. (measuring number of transactions not value)


While there remains a preference of of cash for older Australians, the trend of using cash less is clear.


Summary


Results from the 2013 Survey of Consumers’ Use of Payment Methods indicated that cash remained the most frequently used payment method for day-to-day transactions, though its use relative to other payment methods has declined over recent years. Age was an important factor in determining preferences for the use of cash, with older participants more likely to use cash than younger participants. Consistent with previous surveys, participants were more likely to use cash for low-value transactions relative to other payment methods. Given the continued preference for cash of older participants in the survey, and the dominance of cash for low-value transactions, these results suggest that cash is likely to remain an important part of the payments system for the foreseeable future. 


What does this mean for investors?


There is clearly a change in the use of cash in Australia - which is also taking place around the world.  When thinking of the companies behind alternative payment methods the following names should come to mind - Paypal (owned by eBay), Visa, Mastercard, American Express.  It is no surprise to see these names appear in International investment portfolios.  Yet another reason to spread investment beyond Australian shores.


Investment Alert - be wary of investing in Australian consumer

It is interesting to see the latest Consumer Sentiment graph that was published shortly after the recent Federal Budget.  We have reproduced it below.


What we find most interesting is that consumer sentiment in Australia is now at levels not seen since the depths of the Euro Debt Crisis and the GFC.

While we acknowledge there were some 'negatives' for many in the budget, we would argue that the Federal Budget was hardly a show stopper.  Yet it has resulted in pushing peoples outlook sharply to the negative.

Confidence around housing is particularly fragile in the major states with the index being down by around 30% from September's highs in both NSW and Victoria.

Waning confidence in the housing maret is also apparent in the Index of House Price Expectations.  The index fell by 9.8% in May to its lowest level since January 2013.  Concerns over high prices and limited affordability are likely to be the key reasons behind these trends.

If we look a little more closely at the Australian consumer, we can see that the Australian consumer has not deleveraged since the GFC.  This can be seen in the chart below which shows that households debt to income ratio is virtually back to levels seen just before the GFC.  The average Australian household is very highly leveraged.  It would seem that it takes very little to 'scare' highly leveraged households, such as the recent Federal Budget.


What does this mean for investors?

Consumer sentiment, which is pivotal to spending patterns (ie higher consumer confidence results in higher spending).  The surveys suggest that Australian consumer sentiment is best described as fragile.  This is at a time, when the economic headlines are suggesting that the Australian economy is performing OK.

We are suggesting to exercise caution before investing into sectors that rely on discretionary consumer spending given that households have very high debt levels, the government has made it clear that it intends to reduce government benefits (which can be argued is a  cut to household income) at a time where it seems that interest rates can only move up from here.


This material has been provided for general information purposes and must not be construed as investment advice. This material has been prepared without taking into account the investment objectives, financial situation or particular needs of any particular person. Investors should consider obtaining professional investment advice tailored to their specific circumstances prior to making any investment decisions and should read the relevant Product Disclosure Statement. 

Budget 2014 - An economic perspective

Deficit of $29.8bn, 1.8% of GDP in 2014/2015


Fiscal policy: the path to surplus

The Government projects that the underlying cash balance will be just $2.8bn in deficit in 2017/18, while the fiscal balance will be $1bn in surplus in that year. How has this been achieved? Principally by limiting the growth in nominal outlays through a number of indexation changes that favour the government, while turning indexation back in its favour on the revenue side. It isn’t quite that simple of course - see below - but it is undeniable that the Government’s deus ex machina in this budget has been that when push comes to shove, they can hold down the rate of inflation in their major outlays, while turning inflation in their favour on the other side of the balance sheet.


Savings

The Government plans to slow the real rate of growth in payments to 2.6% over the forward estimates, stating that this will save $20.3bn over five years. The Government’s major innovation here, if we can call it that, is to freeze or lower indexation on its outlays. There will be a ‘pause’ to the indexation of eligibility thresholds for family payments, allowances (for example single parent payments) and the private health insurance rebate. This concept also flows through to Local Government Assistance, the Foreign Aid budget and 112 other government programs. The pause will be either 2 or 3 years. Another move in this spirit has been to introduce the CPI as the reference index for the pension, replacing wages. These measures work to control the nominal growth in government payments over the course of the forward estimates. Direct changes to eligibility for family tax benefit B have also been introduced, with the income threshold moving from $150k to $100k, and the youngest child needing to be less than 6. Elsewhere, the pension age is increased to 70 in 2035 (from 67 from 2023 and 65 today). Medicare is also contributing to the saving (see health below).


Taxation

A "Temporary Budget Repair Levy" on incomes over $180,000 for the three years from 2014-15 ($3.1bn over four years). The reintroduction of indexation of fuel excise from 1 August 2014. Like the freezing of indexation the levy is a short term fix rather than providing long term structural reform. In contrast the restoring the indexation of the fuel excise is a long overdue structural improvement.


Defence & border security

The Government has outlined a target to increase Defence spending to 2% of GDP. They have brought forward $1.5bn in spending from 2017/18 to earlier years. In 2014/15, the Budget delivers $0.14bn for overseas operations, and $0.06bn to contribute to securing Australia’s borders, including Operation Sovereign Borders. The government has committed $0.7bn over six years to enhance border management. From 1 July 2015 the existing border protection services will be consolidated into the new Australian Border Force. It has abandoned the target to increase foreign aid of 0.5% of GDP, while leaving open the option to review this position when the budget is in a stronger state.


Education

The Government has a dual objective here – make higher education cheaper for them and to boost the international competitiveness of the sector. Their answer for both is to deregulate fees, with institutions free to set their own from January 1, 2016. HELP loans will now be repayable when the borrower earns $50k. The interest rate is to be lifted to no more than 6%. The "Gonski" school funding commitments are to be scrapped from 2017-18 with school funding to be indexed to CPI from 2018.


Health

The introduction of a $7 co-payment for visits to the GP, pathology and imaging. The Government is also establishing a Medical Research Future Fund to be funded by $5 from the $7 co-payment. Pharmaceutical prices will increase with general patients paying $5 more for prescription drugs.


Infrastructure

The Government is directly allocating $10.1bn to infrastructure (WestConnex was already committed - if included, this number rises to $11.6bn), which they claim will contribute to $125bn in new projects. This estimate relies on asset sales and ‘asset recycling’, principally at the State level.

Budget 2014 - Temporary Budget Repair Levy

Temporary Budget Repair Levy on income over $180,000

Applies from 1 July 2014 to 30 June 2017

A levy of 2% will apply to an individual’s taxable income over $180,000 per annum for three years from 1 July 2014. In addition, the rate of Fringe Benefits Tax (FBT) will also increase to 49% to prevent high income earners from using fringe benefits to avoid the levy. The increase in the FBT rate will be from 1 April 2015 to 31 March 2017 to align with the FBT year.

A range of other tax rates that align with the top marginal rate are also expected to increase.

The levy amount expected to be paid by taxpayers with taxable income over $180,000 is summarised in the following table. 


Taxable Income   Temporary Budget Repair Levy
$200,000  $400 
 $250,000 $1,400 
$300,000  $2,400 
 

GEM Capital Comment

As the Temporary Budget Repair Levy is proposed to apply to taxable income, strategies which reduce taxable income will result in a reduction in the amount of levy payable. This can be achieved by either reducing assessable income or increasing deductible expenditure.

It is also important to note that while the Temporary Budget Repair Levy is proposed to apply to high income earners, it could also potentially apply to people with income below $180,000 where they:

  • -  sell an asset and realise capital gains, or

  • -  take a superannuation lump sum benefit consisting of taxable component between the age of 55 and 59, as this amount will be included in the taxpayer’s taxable income and could push the client over the $180,000 threshold.

    Taxpayers considering selling assets or taking superannuation lump sums between 1 July 2014 and 30 June 2017 may therefore need to take into account any additional levy they may incur as a result. 


Chinese Manufacturing - Declining

We have been writing about the great stress that of the Chinese Financial System.  One of the outputs of this is likely to show up in manufacturing data. Every month HSBC produces a Chinese Manufacturing Purchasing Managers Index ahead of the actual PMI data that is released.  In short, a reading of higher than 50 means that the Chinese manufacturing sector is expanding, and a reading below 50 means that Chinese manufacturing is contracting.

Key Points:

Flash China Manufacturing PMI at 48.3 in February (49.5 in January).  Seven month low.

Flash China Manufacturing Output Index at 49.2 in February (50.8 in January).  Seven month low.

Data collected 12–18 February 2014.

These charts show a downward trajectory in Chinese manufacturing, which is consistent with a Chinese financial system that is under stress.


$AUD - 30 years of floating - Speech by Glenn Stevens (RBA)

In just a few weeks' time we will pass the anniversary of one of most profound economic policy decisions in Australia's modern history. I refer of course to the decision taken by the Hawke Government in December 1983 to float the Australian dollar and to abolish most restrictions on the international movement of capital.

The decision had been a long time coming. The possibility of a float had been contemplated for years. But the right combination of intellectual climate and circumstances did not arrive until 1983. When it was taken, the decision was a key part of a sequence of very important decisions that opened up the Australian economy and its financial system to international forces, and which changed it profoundly.

Much has been written about that broader reform process. I will speak just about the floating of the dollar itself. I shall pose, and offer answers, to several questions. Why did we float? How has the market developed? How has the exchange rate behaved? What difference did the float make for monetary policy in particular and the economy in general? Has the currency been ‘misaligned’ in ways that have been damaging? And what can be said about intervention?

1. Why did we float?

In a nutshell, I think it is true to say that Australia finally floated the exchange rate because the feasible alternatives had been shown to be ineffective. We had tried just about all the currency arrangements that were known to human kind, with the exception of a currency board: a peg to gold/sterling, a peg to the US dollar, a peg to a basket and a moving peg. All proved ultimately unsatisfactory.

From first principles it could be questioned whether Australia, a country that on occasion experiences quite large shocks in the terms of trade, should have had a fixed exchange rate. The background was the complete breakdown of the international trade and financial system in the 1930s followed by war, which left private capital flows small, central banks and governments dominating capital markets and a distrust of the price mechanism generally. The experience of the early 1950s, however, showed how hard it could be to maintain stability in the face of terms of trade shocks with a fixed exchange rate.[1]

By the early 1980s the intellectual climate had clearly changed. Things had moved on from the post-Depression set of assumptions. More people were conscious of the shortcomings of the regulated era, and were prepared to argue for allowing market mechanisms to set prices and allocate resources.

So there was a case for exchange rate flexibility on ‘real’ or resource allocation grounds. There was also one based on monetary grounds. On the one hand, a fixed exchange rate with a suitable major currency can serve as a ‘nominal anchor’ if we are prepared to accept the monetary policy of the other country through all phases of the cycle. The countries to whose currencies we had pegged, however, had their own circumstances and policy imperatives that evolved differently from our own. Private capital flows had become much larger and our commitment to make a price in the foreign exchange market meant we could not control liquidity in the domestic money market. Inflows of funds in anticipation of a revaluation led conditions to become too easy, and outflows in anticipation of a devaluation tightened up the system. By the early 1980s, with inflation quite high, the lack of monetary control was a serious problem. This was the situation in the lead-up to the decision to float.[2]

2. How has the market developed?

Thirty years ago, the Australian foreign exchange market was relatively small and underdeveloped. At the time of the float, the participants in the market were primarily the domestic commercial banks, though this quickly changed after a number of foreign banks were given licences, increasing competition significantly. After the float, the market matured and grew. Today the Australian dollar is one of the most actively traded currencies. Global daily turnover runs at about $460 billion.[3] The AUD/USD is the fourth most traded currency pair, accounting for just under 7 per cent of global foreign exchange turnover. Compared with the US dollar, the euro or yen, these are small numbers but compared with currencies of several other countries whose economies are noticeably larger than Australia's, the size of the AUD market is remarkably large. It offers the full range of foreign exchange products.

These days more of the trading activity in our currency occurs outside our jurisdiction than inside it, a pattern that is common to most currencies. This reflects the role of international financial centres such as London, which retains a dominant role as a financial hub. Other centres such as Singapore and Hong Kong have made it part of their national ‘business model’ to provide an environment conducive to major financial firms setting up to offer a full menu of financial services to the global investor community. Most countries that are not themselves international financial hubs find that an increasing proportion of trading in their currency takes place ‘offshore’.[4]

3. How has the exchange rate behaved?

At the time of the float, the Australian dollar against the US dollar was actually not very different from its current value (Graph 1). It was worth about 90 US cents in December 1983. That was down from its highest point in the 1970s under the fixed exchange rate system, of US$1.4875. The trade-weighted index was 81 (today about 72), down from a high of around 120. People forget how high the exchange rate was for much of our history.

Graph 1

Graph 1: Australian Dollar 

Click to view larger

Initially after the float, the exchange rate rose for some months before settling back. There was a further very distinct leg down beginning in early 1985. There was quite a lot of drama at the time – this was the era of credit rating downgrades and ‘banana republics’. I think there was a genuine fear at various times that the currency might simply collapse to some ludicrously low value.

With the benefit of that most powerful of tools, hindsight, one can observe that the currency had by the mid 1980s adjusted to a lower mean value, around which it fluctuated for nearly 20 years. One can further note that those trends had some association with developments in Australia's terms of trade (Graph 2). From this vantage point, the market might be argued, on the whole, to have moved the exchange rate to about the right place. And despite the occasional worries about large downward movements, there was probably less high drama associated with them than would have accompanied decisions to devalue a fixed exchange rate.

Graph 2

Graph 2: Real Exchange Rate and Terms of Trade 

Click to view larger

Some trends did seem less explicable, such as when the exchange rate fell below 49 US cents in March 2001 and lingered at very low levels for a while. This was in the wake of a slowdown in the Australian economy, but was also the era of excitement over America's so-called ‘new economy’, and the sense that Australia was an ‘old economy'.[5]

The ‘old economy’ elements like mining would come into their own only a few years later. In 2001, the terms of trade were already rising, and a powerful upswing ensued over the next decade. Even those who were prescient enough to understand the importance of the rise of China have, I suspect, been surprised by the extent of increase in Australia's terms of trade and its longevity. And of course this trend has carried Australia's currency to historically high levels – back, in fact, to about where the floating journey began thirty years ago.

Has the mean value around which the currency fluctuated from the mid 1980s to the mid 2000s now given way to something higher, or will it reassert itself? That is a fascinating question.

4. What difference did the float make?

For the Reserve Bank in its monetary policy responsibilities, the float made all the difference in the world. We no longer had an obligation to stand in the foreign exchange market at a particular price. An earlier decision of the Fraser government to issue government debt at tender meant that the Reserve Bank did not have to stand in the government debt market either. As a result of these two decisions – and they were both important – for the first time the Bank had the ability to control the amount of cash in the money market and hence to set the short-term price of money, based on domestic considerations. This is the hallmark of a modern monetary policy. The extent of short-term variability in interest rates declined while, naturally, that of the exchange rate rose somewhat (Graph 3).

Graph 3

Graph 3: Australian Interest Rate and Exchange Rate Volatility 

Click to view larger

A flexible exchange rate is also a critical component of inflation targeting, which is Australia's monetary policy framework of choice. Admittedly, for some years exchange rate considerations were still sometimes seen as something of a constraint in the conduct of monetary policy. This has been progressively less the case, though, as the credibility of the inflation target has increased.

Even if all the flexible exchange rate did was to allow monetary policy to operate effectively, that was a major benefit. But the float did more than just that. Real exchange rates move in response to various forces affecting an open economy, even if the nominal exchange rate is fixed. Given the slow-moving nature of the bulk of prices, allowing the nominal exchange rate to change makes the process more efficient unless there is excessive short-run variability in the nominal rate. As hedging markets develop the cost of short-run noise is usually lessened. In my view the flexible exchange rate has helped adjustment in the real economy in its own right.

The combination of allowing monetary policy to operate effectively and fostering real economic adjustment is very important. One very telling comparison is between the macroeconomic performance in the most recent commodity price upswing and that in the episodes in the early 1950s and mid 1970s (Graph 4). It is obvious that there has been a first-order reduction in macroeconomic variability on this occasion. The flexibility of the exchange rate has been a major contributor to that outcome.

Graph 4

Graph 4: Terms of Trade, Exchange Rates, Inflation and Real GDP Growth 

Click to view larger

5. Has the exchange rate been ‘misaligned’?

The currency has certainly moved through a very wide range over the thirty years since the float. If our metric were some constant target level of ‘competitiveness’ measured, say, by relative unit costs, then we would be drawn to the conclusion that it has been ‘misaligned’ much of the time.

But such a simple calculation alone isn't the right metric. For a start, over the course of a business cycle the exchange rate should move in ways that help to maintain overall balance between demand and supply. In a period of strong demand it will rise, spilling demand abroad by lowering prices for traded goods and services. This lessens ‘competitiveness’ in the short term, but helps preserve it in the longer term by maintaining discipline over domestic costs.

Moreover, the level of relative unit costs in, say, manufacturing, that is ‘needed’ is a function of several factors, including the terms of trade. A country with an endowment of natural resources will find that when those resources command high prices, it will have a high exchange rate and low manufacturing ‘competitiveness’, compared with the situation when the terms of trade are low. The high resources prices draw factors of production towards the resources sector, pushing up labour costs for other sectors and drawing capital from abroad, so pushing up the exchange rate. The terms of trade rise is an income gain, and may well prompt an expansion in investment in the resources sector. Hence aggregate demand is likely to increase, which among other things will also require a higher exchange rate than otherwise to maintain overall balance. These forces diminish ‘competitiveness’ for other traded sectors. At a later stage, when those adjustments to the capital stock have occurred, the exchange rate may be lower than at its peak, though still higher than what would have been observed had the terms of trade not risen.

So it is not surprising that the exchange rate responds to changes in the terms of trade. It is nonetheless striking how close the empirical relationship has turned out to be. Of course it is not to be assumed that the parameters of that particular empirical relationship are necessarily optimal. But nor is the contrary to be assumed. Over the thirty-year period since the float, that relationship seems not to have led to long periods of the economy either having excess demand or supply. Australia has had one serious recession in that time, in 1990–91, and the principal cause of the depth of that downturn was asset price and credit dynamics, not the exchange rate. Overall, variability of the real economy has been lower in the post-float period. While there are several factors at work in producing that result, the flexible exchange rate is clearly one.

My conclusion, then, would be that evidence of large and persistent exchange rate misalignments is actually rather scant over the floating era as a whole. Arguably some of the bigger misalignments occurred under previous exchange rate regimes.

But what of recent levels of the exchange rate? They have been blamed for many disappointing corporate results and triggered numerous restructurings, instances of ‘offshorings’ and job shedding. The only other factor so frequently offered to explain disappointment is ‘consumer caution’. One can imagine that many people would see this as prima facie evidence of the exchange rate being significantly misaligned.

There are a few difficulties in evaluating that claim. First, very high terms of trade can be expected to lead to some loss of ‘competitiveness’, as noted above. Just how much of this would be expected depends, among other things, on how permanent the terms of trade rise is, but this episode has been very persistent so far. The euphemism ‘structural adjustment’ hardly conveys the difficulties faced by firms and their workforces affected by these forces. But a big and persistent shift in relative prices, which is what the terms of trade shift amounts to, was always going to produce some such effects.

A further difficulty in assessing the exchange rate's level lies in that very persistence. The relationship between the exchange rate and the terms of trade has, broadly speaking, continued to hold (Graph 5). Nothing looks very unusual right at the moment. But this relationship is estimated over a period in which the changes were generally cyclical. It is at least conceivable that a large and persistent rise in the exchange rate may have effects on the economy beyond those discernible from the experience of the past thirty years, if previous rises in the exchange rate were not long-lived enough to cause significant structural change. This is a possibility the Reserve Bank has noted in the past couple of years.[6]

Graph 5[7]

Graph 5: ‘Equilibrium’ Real Exchange Rate 

Click to view larger

There is at least one more complication in assessing the exchange rate's recent behaviour and that is the extraordinary monetary policy measures that are being undertaken in the major economies of the United States, Japan and the euro zone. These too are outside any historical experience. Such measures are in place because they are required by the circumstances of those economies, but there is no doubt that they have fostered the so called ‘search for yield’. That, after all, was the whole point.

Added to this is the lessening, even if only at the margin, of perceived creditworthiness of a number of sovereigns, while our own sovereign rating has remained at the highest level. This has contributed to an increase in ‘official’ holdings of Australian assets as reserve holders sought diversification.

These ‘yield-seeking’ and ‘diversification’ flows have, no doubt, pushed up the Australian dollar. Quantifying that effect is not straightforward. Models suggest that interest differentials have had an effect on the exchange rate, but that effect is dwarfed by the estimated terms of trade effects. But again, the conditions we have seen are unlike anything seen in the period over which the models are estimated.

The flows have surely been important at times, though not necessarily lately. The available data suggest that foreign holdings of Australian government debt stopped rising in the middle of last year. Earlier flows into Australian bank obligations have also generally continued to reverse over that time. As my colleague Guy Debelle has noted, the most obvious capital inflows in the past couple of years have been in the form of direct investment into the mining sector. Those flows were of course responding to expected returns, but not ones that were affected very much by the interest rate policies in the major economies.

In the end it is not possible to come to a definitive assessment on the extent of currency misalignment at the moment, on the basis of standard metrics (and having regard to the statistical imprecision of such metrics). Having said that, my judgement is that the Australian dollar is currently above levels we would expect to see in the medium term.

6. Intervention

In the early period after the float the Reserve Bank undertook market transactions for the purposes of so-called ‘smoothing and testing’. As the market developed and the Bank gained more experience, intervention became less frequent but more forceful. A key motivation for intervention was often trying to avoid the currency moving downwards too quickly. For most of the floating era, until recently at least, a currency that seemed prone to weakness seemed more frequently a problem than the reverse.

As has been well documented, the Bank's intervention strategy has tended to be profitable over the long run.[8] The success of this strategy was helped considerably by the fact that, for much of the floating era, the exchange rate's behaviour could be characterised as fluctuating around a stable mean. If a situation came along that shifted the mean, the strategy might need to be altered.

It might be argued that this is what has happened over the past five years or more. The terms of trade event we have lived through is without precedent in its size and duration, at least in the past century. The exchange rate has responded. Notwithstanding that, in my view, the Australian dollar is probably above its longer-run equilibrium at present, it is far from clear that we can assume that the mean level we saw in the 1980s to the early 2000s will be the relevant one in the future. In evaluating the merits of intervention, the Bank has been cognisant that the current episode is unlike the experience of the first twenty or twenty-five years of the float. Some very powerful forces have been at work.

A further factor relevant to intervention decisions has been cost. Intervening against the Australian dollar would have involved selling Australian assets yielding, say, 3 per cent, and buying foreign assets yielding much less – in fact earning almost nothing over recent years at the areas of the yield curve where the Bank operates. This ‘negative carry’ would be a cost to the Bank's earnings and therefore Commonwealth revenue.

Now it might be argued that a negative carry for the Reserve Bank, and therefore the Commonwealth, and an acceptance of the associated very large valuation risks, would be a price worth paying, if it corrected a seriously misaligned exchange rate. If such a policy were effective, it could turn out to be profitable, if a fall in the exchange rate offset the negative carry. The point is simply that costs have to be considered alongside the likely effectiveness. Often those who argue for intervention don't work through those costs, or they assume it would be entirely costless. That can't be assumed and the idea should be considered in a cost-benefit setting.

Overall, in this episode so far, the Bank has not been convinced that large-scale intervention clearly passed the test of effectiveness versus cost. But that doesn't mean we will always eschew intervention. In fact we remain open-minded on the issue. Our position has long been, and remains, that foreign exchange intervention can, judiciously used in the right circumstances, be effective and useful. It can't make up for weaknesses in other policy areas and to be effective it has to reinforce fundamentals, not work against them. Subject to those conditions, it remains part of the toolkit.

Conclusion

When the foreign exchange market opened on 12 December 1983, without the Reserve Bank making a price for the first time in decades, people would have been uncertain what would happen. Yet policymakers had tried all the alternatives and the float was an idea whose time had come. It was a profound decision – part of a recognition that Australia was part of a wider world, and that we had to reform our own policy and economic frameworks in order to have the sort of prosperity that we wanted as a society.

On 12 December this year we can expect the exchange rate to move a little, one way or the other, and for this to be reported in a very matter-of-fact way on the news broadcasts. We will be able to get updates on our smart phones and to read seemingly limitless quantities of analysis about why it moved the way it did, and predictions about what it might do next, most of which we shall (sensibly) ignore. We would be able, if we wished, to trade foreign currencies from those devices in a way unimagined thirty years ago. (For the record, I am not recommending the practice.) For the dollar to move around in the market as the various players balance supply and demand is now considered normal, and most of the time it is considered no more newsworthy than the price of milk or petrol, and less newsworthy than the price of houses.

Over the past thirty years, the exchange rate has on occasion been the subject of excitement, concern, even shock. It has acted as a shock-absorber, as intended, but it has also served as a disciplining constraint at times. Generally speaking, that was good for us.

At various times we have worried that the market was behaving irrationally, believing that the exchange rate should have been somewhere other than where it was. And sometimes we were right about that. Yet, looking back, on balance the evidence suggests, I think, that the market has mostly moved the exchange rate to about the right place, sooner or later. We sometimes didn't like the pathway. But if I ask the question of whether I would have consistently done a better job setting that price, even had that been feasible (which it wasn't), I don't think I could confidently answer in the affirmative.

No doubt at some Australian Business Economists' occasion on a future anniversary of the float, these matters will be re-examined. We cannot know what the conclusions will be. But for now, and probably for quite some time to come, we remain best served by the floating Australian dollar.

 
Endnotes

* I thank Alexandra Rush for assistance in preparing these remarks.[BACK TO TEXT]

  1. In the early 1950s the Korean War induced a wool price boom, increasing Australia's terms of trade dramatically. Under the fixed exchange rate and without the stabilising effect of an appreciation, the associated increases in national income and aggregate demand led CPI inflation to peak at almost 24 per cent.[BACK TO TEXT]
  2. Remarkably, the decision was taken as the exchange rate was under upward pressure, only a matter of months after a discrete devaluation had been forced on a newly elected government by large capital outflows.[BACK TO TEXT]
  3. Figures from the BIS Triennial Central Bank Survey of foreign exchange and derivatives market activity in April 2013.[BACK TO TEXT]
  4. Should this worry us? At one level it might be concerning that people elsewhere in the world take decisions that have a major bearing on the value of ‘our’ currency. But decisions elsewhere in the world have a major bearing on the price of lots of things we care about: traded products of all kinds, the stock market valuations of our companies, the interest rate on government debt and so on. It is part and parcel of participating in the global economy and being open to foreign trade and capital flows that foreigners have a say in pricing the currency. They can and will do so whether the traders sit in Sydney or Singapore or London. That is a separate question from whether we would benefit from our firms offering more value added in financial services to the investors of the world.[BACK TO TEXT]
  5. We found ourselves ‘out of favour’ despite the fact that it was almost certainly the use of information technology rather than its production that made for the biggest gains to a society and on that score Australia ranked highly. The price put on our currency by the market seemed at odds with other things and that episode saw the first use of results from a model in a speech by a Reserve Bank Governor to demonstrate that point (see Macfarlane 2000).[BACK TO TEXT]
  6. See Lowe P (2012), ‘The Changing Structure of the Australian Economy and Monetary Policy’, Address to the Australian Industry Group 12th Annual Economic Forum, Sydney, 7 March.[BACK TO TEXT]
  7. Graph 5 shows the results from a standard model maintained by the Reserve Bank's staff (Beechey et al. 2000; Stone, Wheatley and Wilkinson 2005). The estimated ‘equilibrium’ level is based on the real exchange rate's medium-term relationship with the goods terms of trade and the real interest rate differential with major advanced economies. In this sense, the estimated equilibrium is the value of the exchange rate justified by these medium-term fundamentals, based on historical relationships. In practice, the terms of trade has historically been the most important determinant of this estimated equilibrium. At any point in time, divergences between the actual real exchange rate and the estimated equilibrium will reflect some combination of the model's short-run dynamics, which include a number of variables that account for financial influences on the exchange rate and an unexplained component. The short-run variables include a financial market-based commodity price measure and variables that capture changes in risk sentiment in financial markets.[BACK TO TEXT]
  8. See Andrew and Broadbent (1994) and Becker and Sinclair (2004).[BACK TO TEXT]

RBA Board minutes for November 2013

Bill Evans, Westpac Chief Economist

As expected, the Minutes to the November RBA Board Meeting retained the key statement that  “The Board’s judgement was that, given the substantial degree of policy stimulus that had been imparted, it was prudent to hold the cash rate steady while continuing to gauge the effects [of the earlier rate cuts], but not to close off the possibility of reducing it further should that be appropriate to support sustainable growth in economic activity”. The Minutes did, however, not contain the comment “nor signal an imminent intention to reduce them” as did the October Minutes. While technically this may open the door for a December move, we doubt the RBA has any imminent intention to reduce the cash rate. Rather, the Board clearly has an easing bias and they would like to highlight the fact.

The Board is “continuing to gauge the effects, including in the housing market, of the substantial degree of monetary policy stimulus that had been put in place over the past two years. There was mounting evidence that monetary policy was supporting activity in interest-sensitive sectors and asset values”. They argue that it is “too early to tell whether this improvement would signal a willingness of businesses to take on new risks and thereby add to employment and investment”.

The Board also gave some insight into why they are in a watch and see, rather than primed to go, mode. “Nationally, dwelling prices were above their late 2010 peak, with prices over the three months to October increasing significantly in Sydney. Housing turnover and loan approvals had picked up noticeably. Improved conditions in the established housing market were providing an impetus to dwelling investment, with residential building approvals increasing over the year". This an expected development from the low level of interest rates and something the Board is hoping will spur on wider domestic activity.

So why does the Board still have an easing bias? They appear to have acknowledged concerns in regards to non-residential investment outlook noting rising office vacancy rates at the same there’s a clear decline in government employment. Downward revisions to the growth outlook have also been noted due to a stronger currency and a larger than expected fall in mining investment.

In addition, employment is forecast to continue to grow below the rate of population growth and hence the unemployment rate is expected to continue to rise gradually for the next year or two. Inflation forecasts are little changed and underlying inflation is forecast to remain consistent with the inflation target for the forecast period.

The other key reason for the rate cut bias is the Australian dollar. It was noted that “the Australian dollar, while below its level earlier in the year, remained uncomfortably high” and that a lower level of the exchange rate would likely be needed to achieve balanced growth in the economy". No doubt the strategy of maintaining an easing bias is partly motivated by the need to "talk down" the AUD.

Nevertheless, the Board is holding to the view that “in time, non-resources business investment was also expected to increase given the low level of interest rates and recent substantial increases in measures of business confidence and conditions”.

The Bank’s forecast for growth appears to be predicated on the current housing story flowing through to consumer spending which as the Board notes “household spending looked to have remained below average in the September quarter, consistent with softness in the labour market weighing on income growth". This is unlikely to materialise until consumers become much more comfortable with their job security.

Note also that the Bank lowered its growth forecast for 2014 from 3% (trend) to 2.5% (below trend) citing a lower trajectory for both mining and non mining investment.

Discussions on the international scene focused on the fact that Australia’s main trading partners growth remained around average. Chinese growth had lifted a little and was consistent with the Government target of 7½% while the Japanese economy continues to grow, albeit at a slower rate than the relatively strong pace seen in the first half of the year. In the rest of Asia, growth has continued around trend.

The US outlook is critical for the RBA as the tapering by the US Federal Reserve will be key factor in their desire to see a stronger US dollar and thus, a weaker AUD. The partial government shutdown in the US is expected to reduce growth only slightly in the December quarter although it is too early to tell as several data releases have been delayed. While house prices have risen further, it was noted that US housing starts and mortgage applications for purchases had declined since earlier in the year. Overall, the US economy was described as growing at a moderate pace.

Conclusion

The Bank has noted the recent strength in consumer and business confidence as well as the upswing in house prices and dwelling approvals. However, there are clear question marks on the sustainability of this upswing and if it can be maintained into 2014 given the downbeat outlook for non-residential construction; an expectation for a rising unemployment rate; the slowdown in mining; weak government spending; and the drag on our external sector from an "uncomfortably high AUD".

There are many dimensions of uncertainty in the outlook. The Bank is looking for the wealth/employment/confidence boost from the housing upswing to feed into the weak area of the economy mainly explained by business decisions on employment and investment.

It is our view that the pass through will be slow and uneven requiring further monetary stimulus in 2014. The minutes confirm that the decision to cut is not imminent and will depend on how those dynamics interact.

We continue to expect the Bank will become increasingly aware of the need for lower rates in 2014.

It is our view, that two further cuts in the cash rate will be required in 2014.


The Australian election and investors

The Federal Election

With the much anticipated Australian Federal election now set for 7 September it is natural to wonder what impact, if any, there might be on investment markets – both in terms of the uncertainty created by the election itself and in terms of the outcome. At present while opinion polls have Labor and the Coalition running at around 50% each on a two party preferred basis, according to bets placed on online betting agency Centrebet the Coalition remains the clear favourite.

Source: Centrebet

The performance of markets around elections

Elections can potentially have a short-term impact on investment markets. This is because investors don’t like the uncertainty associated with the prospect of a change in government during the campaign and then there may be relief once the poll is out of the way and possibly optimism associated with the election of a new Government.

The next chart shows Australian share prices from one year before till six months after Federal elections since 1983. This is shown as an average for all elections (but excludes the 1987 and 2007 elections given the global share crash 3 months after the 1987 election and the start of the global financial crisis in 2007), and the periods around the 1983 and 2007 elections, which saw a change of government to Labor, and the 1996 election, which saw a change of government to the Coalition. The chart suggests some evidence of a period of flat lining in the run up to elections, possibly reflecting investor uncertainty before the poll, followed by a relief rally soon after it is over.

Source: Thomson Financial and AMP Capital

However, the elections when there has been a change of government have seen a mixed picture. Shares rose sharply after the 1983 Labor victory but fell sharply after the 2007 Labor win, with global developments playing a big roll in both. After the 1996 Coalition victory shares were flat to down. The point is that based on the historical experience it’s not obvious that a victory by any one party is best for shares in the short term and, in any case, historically the impact of swings in global share markets arguably played a much bigger role than the outcomes of Federal elections.

What is clear though is that after elections shares tend to rise more than they fall.The next table shows that 8 out of 11 elections since 1983 saw the share market up 3 months later with an average gain of 5.4%, which is above the 1.8% average 3 monthly gain over the whole period.

Source: Bloomberg, AMP Capital

The next chart shows the same analysis for the Australian dollar. In the six months or so prior to Federal elections there is some evidence the $A experiences a period of softness and choppiness which is consistent with uncertainty about the policy outlook, but the magnitude of change is small – just a few percent. On average, the $A has drifted sideways after elections. While the $A fell soon after the 1983 Labor victory this was due to a policy devaluation in the dying days of the fixed exchange rate system.

Source: Thomson Financial, AMP Capital

The next chart shows the same analysis for Australian bond yields. Interestingly, on average bond yields have drifted down over the six months prior to Federal elections since 1983. The average decline has been around 0.75% which is contrary to what one might expect if there was investor uncertainty regarding the policy outlook. However, the tendency for bond yields to decline ahead of Federal elections appears to be more related to the aftermath of recessions, growth slowdowns and/or falling inflation prior to the 1983, 1984, 1987 and 1993 elections and the secular decline in bond yields through the 1980s and 1990s in general. More broadly, it’s hard to discern any reliable affect on bond yields from Federal elections.

Source: Thomson Financial, AMP Capital

Policy change and shares

Over the post war period shares have had an average return of 12.9% pa under Liberal/National Coalition Governments compared to 9.8% pa under Labor Governments.

Source: Thomson Financial and AMP Capital

Some might argue though that the Labor Governments led by Whitlam in the 1970s and Rudd and Gillard more recently had the misfortune to be affected by severe global bear markets beyond their control and if these periods are excluded the Labor average rises to 14.6% pa. Then again that may be pushing things a bit too far. But certainly the Hawke/Keating government defied conventional perceptions that conservative governments are always better for shares. Over the Hawke/Keating period from 1983 to 1996 Australian shares returned 17.3% pa, the strongest pace for any post war Australian government.

Once in government political parties of either persuasion are usually forced to adopt sensible macro economic policies if they wish to ensure rising living standards. Both the Coalition and Labor agree on the key macro fundamentals – i.e. the need to keep inflation down, to return the budget to surplus and in the benefit of free markets.

Policy differences

The main areas of difference between the two parties of probable economic significance relate to taxation, climate change, government spending & the budget and regulation.

  • in terms of tax the Coalition has promised to cut the company tax rate (although for large companies this is partly offset by a paid parental leave scheme) and abolish the mining tax;
  • the Coalition is proposing to abolish the carbon tax/Emissions Trading Scheme and will rather pay companies to reduce emissions;
  • the Coalition is likely to take a lighter/more business friendly approach to regulation than a Labor government. This may involve some partial wind back of industry regulation; and
  • the Coalition will likely try and speed up the return to a budget surplus by cutting government spending, much as it did under John Howard following the 1996 election.

As a result, perceptions that the Coalition will be lower taxing and less focussed on regulation and hence more business friendly than a Labor government may increase the chance a Coalition victory will result in a typical post election share market bounce. However, it’s worth noting that this may be partially offset if it announces aggressive fiscal tightening after the election (given the negative impact this could have on economic growth and profits at a time when the economy is already soft). What's more if a returned Labor Government follows up on its commitment to a National Competitiveness Agenda working to seriously boost productivity growth then it could have a positive long term impact on growth, profits and ultimately share market returns.

However, it does seem that there is the potential for significant sectoral impacts with the Coalition’s policies likely to be positive for miners, heavy carbon emitters and small companies (due to the company tax rate cut).

Concluding comments

The historical record points to the strong chance of a post election share market bounce. This may also fit in as we move out of the September quarter, which is often the weakest of the year, into the normally strong December quarter, as the profits reporting season ends in Australia and as uncertainty is removed post a possible September decision by the US Federal Reserve to start tapering its monetary stimulus.

Another potential positive from the election is that it is likely to see the end of minority government in Australia as whoever wins is likely to have a clear majority in the House of Reps. This could help usher in a period of more certain and rational policy making. However, it’s not guaranteed as whoever wins may still not have control of the Senate.

Dr Shane Oliver
Head of Investment Strategy and Chief Economist
AMP Capital

Important note: While every care has been taken in the preparation of this article, AMP Capital Investors Limited (ABN 59 001 777 591, AFSL 232497) and AMP Capital Funds Management Limited (ABN 15 159 557 721, AFSL 426455) makes no representations or warranties as to the accuracy or completeness of any statement in it including, without limitation, any forecasts. Past performance is not a reliable indicator of future performance. This article has been prepared for the purpose of providing general information, without taking account of any particular investor’s objectives, financial situation or needs. An investor should, before making any investment decisions, consider the appropriateness of the information in this article, and seek professional advice, having regard to the investor’s objectives, financial situation and needs. This article is solely for the use of the party to whom it is provided.

Yet another (big) budget downgrade...... UBS view

Kevin Rudd last week announced the pre-election budget update.  Here is an extract from UBS economic team that provides a summary of this announcement.

Key new measures (over 4 years) are:

Savings:

Tobacco tax $5.8bn

PBS price changes $2.0bn

FBT on cars $1.8bn

Other ETS saves $2.1bn

Public sector efficiency $1.8bn

Delayed Foreign aid $1.0bn

Higher tax compliance $0.8bn

Bank deposit levy $0.7bn

Superannuation changes $0.6bn


Spending:

New PBSA listings $1.4bn

PNG aid and resettlement $0.5bn

Non-claw back of carbon comp $3-4bn

Deffered self-education changes $0.3bn


RBA cuts rates to 2.50%

Surprisingly moves to neutral bias.

As widely expected the Reserve Bank Board decided to lower the cash rate by 25bps to 2.50% at its August Board meeting.

For us by far the most significant aspect of the Governor's statement was the decision to move back to a neutral bias from the consistent easing bias that we have seen in recent statements.

It does not hold that a central bank should necessarily move to a neutral bias following a rate move. An easing bias was used in the May statement despite delivering a rate cut. The words used were: "The Board has previously noted that the inflation outlook would afford scope to ease further ... at today's meeting the Board decided to use some of that scope". That is a more dovish explanation for a rate cut than that used today "The Board judged that a further decline in the cash rate was appropriate".

We were expecting that the Bank would choose to maintain downward pressure on the AUD by repeating the rhetoric from the June and July statements which said: "The Board judged that the inflation outlook ... may provide some scope for further easing should that be required to support demand". In today's statement the key final sentence was: "The Board will continue to assess the outlook and adjust policy as needed to foster sustainable growth in demand and inflation outcomes consistent with the inflation target over time" – a clear neutral bias.

Other aspects of the statement were more encouraging from the perspective of our forecast which has been and remains for another cut in November. Firstly, the statement followed the structure in July by pointing out that although the Australian dollar has depreciated 10% since early April it remains at a high level. The only change in this statement was to revise that change up to 15%.

The other really important point was that despite the 15% fall in the currency the Governor repeated his confidence that inflation pressures are expected to remain under control. Comments on the real economy did not change from the July statement with growth being described as "a bit below trend" and the unemployment rate being recognised as edging higher.

The international outlook remains unchanged with global growth being described as "running a bit below average this year". A new observation is the linking of volatility in the global financial markets with a downturn in a number of emerging market economies. That link to emerging markets was not made in July.

Conclusion

In choosing not to maintain a clear easing bias it seems very unlikely that the September meeting will be 'in play'. Of course, with that meeting being timed for four days before the Federal election it would have been quite surprising to see any change in monetary policy so close to an election. We are not unnerved by today's approach because it in no way implies that rates have reached some form of institutional low and that should the economy evolve in the way we expect the Bank will cut rates again.

The calling of the election, by providing some political certainty by early September, might boost confidence measures but hard decisions showing up in the data to raise employment and investment seem a lot further off. We also agree with the Reserve Bank that the fall in the currency is most likely to impact importers' margins rather than consumer prices. A much stronger demand environment would be required for importers to confidently pass on price increases. We have not doubt that the Bank expects there is more work to be done. Note that the Government raised its unemployment forecast for 2013-14 from 5.75% to 6.25% and expects it to remain there over the course of the next year. We expect that the Reserve Bank feels the same way, although Friday's Statement on Monetary Policy will only include growth and inflation forecasts.We expect the Bank would therefore have no hesitation in cutting rates again once more information is available on inflation which will print in late October and the response of business/consumers to the election result has been clearly signalled.

We also believe that these dampening forces will be sustained through into early 2014 providing scope for another cut in February.


Written by Bill Evans

Chief Economist - Westpac Banking Corporation

RBA holds rates steady, easing bias intact

As expected the Reserve Bank Board decided to leave the cash rate unchanged
at 2.75% at its June meeting.

The Governor's statement accompanying the decision presented taken as a
whole leaves us comfortable with our existing position: a 2% terminal rate
with the next easing in August.

The key concluding paragraph retained a clear easing bias but also made it
clear the Bank was in assessment mode – not only on the need for further
support for demand but also the degree to which the inflation outlook
afforded scope for further measures. Monetary settings were judged to be
'easy' and sufficient to "contribute to a strengthening of growth over
time, consistent with achieving the inflation target". And settings were
seen as "appropriate for the time being", the phrasing indicating the
Bank's views may be reassessed month to month.

However, the closing sentence gave a more uncertain view on the scope for
further easing: "the inflation outlook, as currently assessed, may provide
some scope for further easing, should that be required to support demand."
That contrasts with the statement accompanying the May decision to cut
rates which had a more definitive assessment that "the inflation outlook
would afford scope to ease further ..." with the Board choosing to "use
some of that scope". The changed emphasis points to the RBA seeking more
comfort on inflation, suggesting any follow on move is more likely to occur
post CPI in August than at July's meeting.

The sharp decline in the AUD is also likely a factor in the more qualified
view on 'scope'. The Bank may be seeking not only to reassess what impact
this may have on inflation but where the current move settles. Notably, the
statement acknowledges the decline in the currency but asserts that the
exchange rate "remains high considering the decline in export prices". That
aligns with our own view that the decline has merely reduced the degree of
overvaluation rather than eliminated it altogether (in USD terms we see the
decline as having reduced a 10c overvaluation to one around 3c). The Bank
may also share our concern that the change in market expectations on Fed
policy (a 'tapering' in QE purchases), which has been a key driver of
recent currency moves is misplaced and could reverse quickly.

The rest of the Governor's statement was brief. Global growth was seen
running a bit below average with "reasonable prospects of a pick-up next
year".  =Australia's growth was seen as "a bit below trend" and inflation
consistent with the medium term target.

The description of the impact of previous policy easing was decidedly more
downbeat though. In April, the Governor's statement boldly asserted that
there were "a number of indications that the substantial easing of monetary
policy during late 2011 and 2012 is having an expansionary effect on the
economy". In May, the view was that there had been "a strengthening in
consumption and a modest firming in dwelling investment". In June though
the statement looks less convincing with simply: "The easing in monetary
policy over the past 18 months has supported interest-sensitive areas of
spending".
Also of note, the view on business investment statement is not touched on
at all. This may be due to heightened uncertainty around the timing of the
mining investment cycle but is notable given the resilience of investment
plans revealed in last week's ABS Capex report.
We saw this has a key factor in the RBA leaving rates on hold this month
and it might have been put forward as a positive sign but instead the Bank
has opted not to discuss the investment outlook directly at all.

Conclusion
The Reserve Bank has retained an easing bias, but it is not an urgent one.
The path of easing from here will depend on developments in demand; the
financial markets (the $A, as it jointly impacts demand and inflation) and
the inflation story itself. The most important piece of information on the
latter front will come to hand between the July and August meetings, in the
form of the second quarter CPI. We have a more downbeat view on global growth next year and our domestic forecasts are also lower than the Bank's. As such we
already see a strong case for further monetary policy easing. However, the
tone of today's statement implies that the RBA Board is looking for further
evidence before acting again, which points to rates being kept on hold in
July.  However, it is likely to signal at that meeting that the forthcoming
inflation print could provide scope for it to support demand further within
the context of its target. That intent would then be actioned at the August
meeting. Beyond that point, we see two further 0.25% rate cut moves, in the last quarter of
this year and the first quarter of next year.


Westpac Economics Team


This material has been provided for general information purposes and must not be construed as investment advice. This material has been prepared without taking into account the investment objectives, financial situation or particular needs of any particular person. Investors should consider obtaining professional investment advice tailored to their specific circumstances prior to making any investment decisions and should read the relevant Product Disclosure Statement.

China - a controlled slowdown, not a train wreck

The most important influence on the Australian economy is arguably China, given our vast exports to China.

The Chinese authorities have successfully cooled the economy down, without trashing it.


RBA keeps rates on hold in March - next move likely lower

As expected Reserve Bank Board holds rates steady at March meeting

As we expected the Board of the Reserve Bank decided to hold the cash rate
steady at 3% following today's Board meeting.

There were minimal changes in the wording of the Governor's statement from
the statement issued on February 5 following that "no change" decision.

Of most importance was retaining the term "the inflation outlook, as
assessed at present, would afford scope to ease policy further should that
be necessary to support demand". Maintaining that statement indicates that
the Board retains an easing bias and future decisions will be impacted by
the growth profile.

By far the most important data release since the last meeting was the
Capital Expenditure survey for the December quarter. This survey provided
the first estimate of investment plans for the 2013-14 fiscal year. It also
provided the fifth updated estimate for investment in 2012-13. The news on
2012-13 was quite poor with substantial downward revisions to investment
plans. However, partly because the 2012-13 number was so low it was not too
big a stretch for the 2013-14 investment plans to show a solid increase.
Indeed by our calculations those plans indicated an 11% boost in investment
in 2013-14. That evidence is likely to have been a key factor in the Bank's
decision to hold rates steady. Indeed, while investment outside mining
continued to be assessed as "relatively subdued" the Governor did qualify
that with "recent data suggest some prospect of a modest increase during
the next financial year". Hence from the Bank's perspective progress in
rebalancing growth towards the non-mining sectors appeared to be underway.

Another aspect of the Capex survey indicated that the peak in resource
investment might be further out than previously assessed. However, there is
considerable uncertainty around those estimates and the Bank, prudently,
retained its general assessment that "the peak in resource investment is
approaching".

The themes that have figured consistently in previous statements were
repeated today – moderate growth in private consumption; near term outlook
for non residential building subdued; exports strengthening; public
spending constrained; inflation consistent with the medium term target; and
low demand for credit.

The wording on the housing market changed. Whereas in February it was
described as: "prospective improvement in dwelling investment", it is now
described as: "appears to be slowly increasing". This somewhat more
positive assessment is the direct result of a modest 2.1% reported increase
in housing construction for the December quarter. Higher dwelling prices
and rental yields are also noted.

The conviction that inflation will remain consistent with the medium term
target is given more support in this statement. Whereas the February
statement predicted that a soft labour market would be working to contain
pressures on labour costs this statement notes that this result has indeed
been "confirmed in the most recent data". In the February statement the
Bank raised the prospect of businesses focussing on lifting efficiency to
contain wage pressures and this sentiment is retained.

The description of the international situation is largely unchanged
although the Governor appears to be a little more confidence around
downside risks. Compare "downside risks appear to have abated, for the
moment at least" (February) with "downside risks appear to have lessened in
recent months".

The description of financial markets includes a more upbeat assessment of
the sharemarket, "share prices have risen substantially from their low
points". However, the Bank continues to point out that financial markets
remain vulnerable, adding "as seen most recently in Europe".

The key theme is repeated in this statement, "the full impact of this
[easing in monetary policy] will still take more time to become apparent,
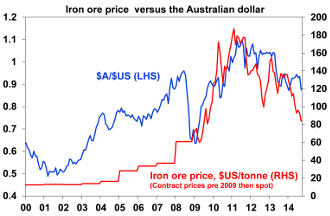
there are signs that the easier conditions are having some of the expected
effects".

Despite the recent fall in the AUD (substantially more in USD terms than in
TWI terms) the Bank continues to point out that the exchange rate remains
higher than might have been expected.

Conclusion – expect the next rate cut by June.
This statement is clearly structured to signal that the Bank retains its
easing bias but will be patient before cutting rates further.

We believe that there will be another cut in this cycle but not until
around June. Forces that are most likely to highlight the need for lower
rates will be around: an ongoing softening in the labour market; contained
price and wage pressures; a disappointing response from business in terms
of investment; and a housing recovery that, while quite vibrant in Sydney,
will not be replicated around the country. We also expect that the
Australian dollar will be drifting higher through to mid year particularly
as foreign investors rebalance their appetite back towards high yielding
Australian assets.

Bill Evans
Chief Economist
Westpac Institutional Bank


This material has been provided for general information purposes and must not be construed as investment advice. This material has been prepared without taking into account the investment objectives, financial situation or particular needs of any particular person. Investors should consider obtaining professional investment advice tailored to their specific circumstances prior to making any investment decisions and should read the relevant Product Disclosure Statement.


Is the mining boom over and would it be so bad if it is?

Key points

  • The mining investment boom still has another year or two to go but its peak is starting to come into sight and the best has probably been seen in terms of commodity prices.
  • While there is the risk of a timing mismatch around the end of the investment boom in 2014 and as other sectors take over in driving Australian economic growth, the eventual end of the mining investment boom should lead to more balanced Australian growth.
  • The eventual slowing of the mining boom should mean lower interest and term deposit rates, the best is over for the Australian dollar (A$) and a more balanced share market.

Introduction

Recent weeks has seen much debate and consternation in Australia as to whether the mining boom that has supposedly propelled the economy for the last decade is over. This followed the cancellation or delay of various resource investment projects including the massive Olympic Dam expansion and a fall in commodity prices over the last year.
But is it really over? And would it really be the disaster for Australia that many fear? After all, we have had years of hearing about the two-speed economy where the less resource-rich south eastern states were being left behind and it was said that the people of western Sydney were paying the price (via higher-than-otherwise interest rates and job losses) for the boom in Western Australia, so many Australians might be forgiven for thinking good riddance.

Semantics and confusion

Much of the debate about whether the mining boom is over has been characterised by confusion as to what is being referred to with some focusing on commodity prices, others on mining investment projects and others saying that technically it hasn’t even begun until mining and energy exports pick up. In broad terms the mining boom that has gripped Australia for the last decade likely has three stages.

The first stage, or Mining Boom I (MB I), began last decade and saw surging resource commodity prices driven by industrialisation in China. This resulted in a rise in Australia’s terms of trade to near record levels (see the next chart). This phase was initially good for
Australia last decade as it seemingly benefited everyone. Resource companies got paid more for what they produced, their profits surged, they employed more people, and they paid more taxes, which led to budget surpluses and allowed annual tax cuts. They paid more dividends and their share prices went up. The A$ rose but not to levels that caused huge problems for the rest of the economy. So, not only did the resources companies benefit but there was a big trickle down effect to almost everyone else. As a result the economy performed very strongly and unemployment fell below 4%.


The second stage, or Mining Boom II (MB II), has been characterised by a surge in mining and energy investment. This has been underway for the last few years and will take mining investment from around 4% of gross domestic product (GDP) in 2010 up to around 9% in 2013, contributing around 2 percentage points to GDP growth in each of 2011-12 and 2012-13.


The third stage, or Mining Boom III (MB III), will presumably come when resource exports surge on the back of all the investment.  So where are we now? In terms of the commodity price surge that characterised MB I, it’s likely that we have either seen the peak or the best is over with more constrained gains ahead:

  • Firstly, the pattern for raw material prices over the past century or so has seen roughly a 10-year secular or long-term upswing followed by a 10- to 20-year secular bear market, which can sometimes just be a move to the side.


The upswing is normally driven by a surge in global demand for commodities after a period of mining underinvestment. The downswings come when the pace of demand slows but the supply of commodities picks up in lagged response to the price upswing. After a 12-year bull run since 2000 this pattern would suggest that the commodity price boom may be at or near its end.

  • Global growth appears to have entered a constrained patch. Excessive debt levels in the US, Europe and Japan have constrained growth, while potential growth in China, India and Brazil looks like being 1 or 2 percentage points lower than was the case before the global financial crisis. This means slower growth in commodity demand going forward.
  • The supply of raw materials is likely to surge in the decade ahead in response to increased investment.
  • Finally, the surge in commodity prices since 2000 was given a lift by a downtrend in the US dollar from 2002 as commodity prices are mostly priced in US dollars. This has now likely largely run its course.

Taken together, this would suggest that the best of the commodity price surge since 2000, or MB I, is behind us. There are two qualifi cations though. First, after the recent short-term cyclical slump there will still be a rebound, probably into next year as global growth picks up a bit. Second, it’s way too premature to say that the surge in demand in the emerging world is over - China and India are still very poor countries with per capita income of just US$8,400 and US$3,700 respectively compared to US$40,000 in Australia suggesting plenty of catch-up potential ahead and related commodity demand.

In terms of MB II, while the cancellation of Olympic Dam and other marginal projects indicates that projects under consideration have peaked, this does not mean the mining investment boom is over. In fact it probably has another one to two years to run. Based on active projects yet to be completed there is a pipeline of around A$270 billion of work yet to be completed. Iron ore related capital spending (on mines and infrastructure) are likely to peak this fi nancial year and coal and liquid natural gas related investment is likely to peak in 2014-15, suggesting a peak in aggregate around 2014.

In other words, the boom in mining investment has 18 months or so to run before it peaks and starts to subside back to more normal levels. But what can be said though, is with the cancellation of marginal projects that were in the preliminary stage, the end is coming into sight.

Finally, MB III or the pick-up in export volumes flowing from the surge in mining investment in iron ore, coal and liquefied natural gas will start to get underway around 2014-15.

Heading towards a more balanced economy

Talk of the end of the mining boom has created a bit of nervousness regarding the outlook for Australia. However, the reality is that the current stage of the mining boom focused on
mining investment has not been unambiguously good for the economy and its inevitable end should hopefully see Australia return to a more balanced economy.

It was always thought that after two or three years the surge in mining investment would settle back down as projects ran their course. Trying to do a whole lot of projects in a relatively short space of time was always fraught with the threat of excessive cost
pressures and an excessive surge in supply. We are now seeing market forces kicking in to rationalise resource projects and so the more marginal projects are being delayed. This is a good thing as it will reduce cost pressures, leave work for the future and reduce the
size of the commodity supply surge over the decade ahead thereby helping avoid a crash in commodity prices.

The cooling down of the mining investment boom should help lead to a more balanced economy. MB II has not been good for big parts of Australia. With roughly 2 percentage points of growth coming from mining investment alone it has really put a squeeze on the
rest of the economy. Housing and non-residential construction, retailing, manufacturing and tourism have all suffered under the weight of higher-than-otherwise interest rates and a surge in the A$ to 30-year highs.

What’s more the boom in mining investment has meant that the Federal Government has not seen the tax revenue surge it got last decade, so last decade’s regular tax cuts have not been possible and this has weighed on household income.
This is all evident in the Australian share market which has underperformed global shares since late 2009, with the resource sector being the worst performer over the last year as resource sector profits have fallen 15% or so.

So, the end of the mining investment boom, to the extent that it takes pressure off interest rates and the A$, should enable the parts of the economy that have been under the screw for the last few years to rebound, leading to more balanced growth. This is also likely to be augmented by a pick-up in resource export volumes equal to around 1% of GDP from around 2014-15 according to the Bureau of Resource and Energy Economics.

Of course a risk is of a timing mismatch around 2014 as investment slows down with other sectors taking a while to pick up. To guard against this the Reserve Bank will clearly need to stand ready to respond with lower interest rates.

The bottom line is that the end of the mining investment boom in a year or two won’t necessarily be bad for the Australian economy and will likely see a return to more balanced growth.

Concluding comments
It’s premature to call the end of the mining boom just yet. The peak in mining investment probably won’t be seen until 2014 and thereafter actual mining production and hence exports will start to pick up. However, the best has probably been seen in terms of commodity price gains and the end of the investment boom is starting to come into sight.
While there may be the risk of slower growth as the Australian economy shifts gears away from mining investment in 2014 to mining exports, construction and other parts of the economy that have been subdued, the end of the investment boom should lead to a more balanced economy reflecting less pressure on the interest rates and the A$.
For investors there are several implications including:

  • Ongoing pressure for lower interest rates as the risk of an overheating economy subsides. This means that term deposit rates are likely to fall further in the years ahead.
  • The best has likely been seen for the A$, implying less need to hedge global shares back to Australian dollars.
  • Resources shares are currently cheap and should experience a cyclical rebound when confidence in global growth improves.
  • However, beyond a short-term bounce it’s likely that the cooling of the mining boom will allow a return to a more balanced share market with domestic cyclicals likely to perform better.

This material has been provided for general information purposes and must not be construed as investment advice. This material has been prepared without taking into account the investment objectives, financial situation or particular needs of any particular person. Investors should consider obtaining professional investment advice tailored to their specific circumstances prior to making any investment decisions and should read the relevant Product Disclosure Statement.

Health/Reality Check on the Australian Economy

David Murray, the former CEO of the Commonwealth Bank and former head of the Future Fund spoke recently to the 7.30 Report.

He spoke about the current path of the Australian economy and whether it is sustainable.

http://www.youtube.com/watch?v=7-U2f5ttNdA


Consumer Sentiment rises slightly but remains weak

•The Westpac Melbourne Institute Index of Consumer Sentiment rose by 1.6% in September from 96.6 in August to 98.2 in September

This is the seventh consecutive month that the Index has been below 100. Apart from the 2008/09 period when the Index held below 100 for 16 consecutive months this represents the longest run of consecutive ‘sub 100’ prints since the early 1990s. Furthermore, there have only been two months in the last 15 when the Index has printed above 100.

The consumer is clearly stuck in an extended ‘cautiously pessimistic’ phase. In September last year the Index printed 96.9 so it has only increased by 1.3% over the whole year. That is despite 1.25% of rate cuts from the Reserve Bank; a more or less steady unemployment rate which is close to full employment; and some recent positive news around the threatening European situation.

This does not bode well for consumer spending and is consistent with the slowdown in consumer spending indicated by the June quarter national accounts. Although this followed a strong March quarter rise, the softening has come despite major policy boosts to household incomes including $1.9bn in fiscal handouts. With a sharp fall in July retail sales confirming this boost is now reversing, underlying momentum appears to be soft, in line with the consistently downbeat signal from the Consumer Sentiment Index.

Media coverage is often a major factor shaping respondents’ confidence including how they assess their own financial position and how they evaluate macro issues.

In the September report we receive an update on the news items which are capturing the attention of consumers and whether these were favourable or unfavourable. It shows the dominant news in September was around ‘economic conditions’ with 47% recalling news on this issue. Next was ‘budget and taxation’ (39.8% recall); international conditions (25.5% recall); and employment/wages (20.6% recall). Other topics registering lower recall include covered interest rates; inflation; politics and the Australian dollar.

Since June, the overall sentiment Index has increased by a modest 2.7%. Respondents generally recalled slightly less unfavourable news on international conditions although these items were still overwhelmingly negative. Other news was viewed as even more unfavourable than in June.

Four of the five components of the Index increased with the sub- indexes tracking views on “family finances compared to a year ago” up 0.3%; “family finances over the next 12 months” up 4.8%; “economic conditions over the next 12 months” up 0.6% and “economic conditions over the next 5 years” up 3.4%. The sub- index tracking views on “whether it is a good time to buy a major household item” fell by 0.4%.

By June this year we were particularly concerned by readings on “family finances over the next 12 months” which was printing at a level around the low-point of the 2008-09 period. Since thenwe have seen an encouraging improvement in this component which has increased by 11.4%. However it is still at a historically low level. For example the average print of that component during that 2008/09 period when the Index registered 16 consecutive months below 100 was 105.2 – today’s print of 96.2 is still well below that average. We can only conclude that respondents remain concerned about their finances despite the recent rally.

This survey also provides a quarterly update on respondents’ savings preferences. There was a sharp increase in the proportion of those respondents who assess bank deposits to be the wisest place for savings, with that proportion increasing from 32.6%

in June to 39.0% in September. That proportion is the highest proportion since December 1974 and comfortably exceeds the peak proportion during the 2008/09 period of 36.9%. For this survey the 6.4ppt increase in preference for bank deposits was at the expense of real estate which fell from 25.0% in June to 19.8% in September. The proportion of respondents favouring shares stayed near record lows at 5.5%, while the proportion opting for ‘pay down debt’ was steady at 20.4%.

If we compare the total proportion of respondents who prefer conservative savings options, covered by bank and other forms of deposits in conjunction with “pay down debt” the current proportion registers 63.5% of respondents. That compares with 64.2% in December 2008 when we were at the height of risk aversion during the Global Financial Crisis. In short, respondents are exhibiting a similar level of risk aversion in terms of their savings preferences as we saw in 2008.

The Reserve Bank Board next meets on October 2. Our forecast has been and remains that the Bank will decide to cut the official cash rate by 50bps over two meetings by year’s end. The case for lower rates is strong. Inflation remains well contained and the Bank’s own forecast has inflation remaining consistent with the target over the next one to two years. Interest rates are only slightly below neutral levels. The June quarter national accounts showed that consumer spending is slowing and investment in residential construction and plant and equipment has been contracting for the last few quarters. Despite a near 10% fall in the terms of trade the Australian dollar has failed to perform its usual ‘shock absorber’ role. Fiscal policy at both Federal and

state levels is tightening. Both consumer and business confidence are soft. From a domestic perspective only the fall in the unemployment rate and the ongoing surge in mining investment counter the case for lower rates. However, the fall in the unemployment rate has been due to discouraged workers leaving the workforce while the medium term outlook for the mining investment has recently been revised down by some mining companies.

In short, we think the case for lower rates has already been made and there must be a reasonable chance that the Bank will decide to move in October. However, central banks are conservative so a November ‘call’ for the first move looks to be more prudent.

Bill Evans, Chief Economist


Disclaimer

Westpac Institutional Bank is a division of Westpac Banking Corporation ABN 33 007 457 141 AFSL 233714 (‘Westpac’). This document is provided to you solely for your own use and in your capacity as a wholesale client of Westpac. The information contained in this communication does not constitute an offer, or a solicitation of an offer, to subscribe for or purchase any securities or other financial instrument; does not constitute an offer, inducement or solicitation to enter a legally binding contract. The information is general and preliminary market information only and while Westpac has made every effort to ensure that information is free from error, Westpac does not warrant the accuracy, adequacy or completeness of the Information. The information may contain material provided directly by third parties and while such material is published with necessary permission, Westpac accepts no responsibility for the accuracy or completeness of any such material. Although we have made every effort to ensure the information is from error, Westpac does not warrant the accuracy, adequacy or completeness of the information, or otherwise endorse it in any way. Except where contrary to law, Westpac intends by this notice to exclude liability for the information. The information is subject to change without notice and Westpac is under no obligation to update the information or correct any inaccuracy which may become apparent at a later date. Past performance is not a reliable indicator of future performance. The forecasts given in this document are predictive in character. Whilst every effort has been taken to ensure that the assumptions on which the forecasts are based are reasonable, the forecasts may be affected by incorrect assumptions or by known or unknown risks and uncertainties. The ultimate outcomes may differ substantially from these forecasts.

This communication does not constitute a personal recommendation to any individual investor. In preparing the information, Westpac has not taken into consideration the financial situation, investment objectives or particular needs of any particular investor and recommends that investors seek independent advice before acting on the information. Certain types of transactions, including those involving futures, options and high yield securities give rise to substantial risk and are not suitable for all investors. Except where contrary to law, Westpac intends by this notice to exclude liability for the information. The information is subject to change without notice. A product disclosure statement (“PDS”) may be available for the products referred to in this document. A copy of the relevant PDS and a copy of Westpac’s Financial Services Guide can be obtained by visiting www.westpac.com.au/ disclosure-documents. You should obtain and consider the relevant PDS before deciding whether to acquire, continue to hold or dispose of the applicable products referred to in this document.

This document is being distributed by Westpac Banking Corporation London Branch and Westpac Europe Limited only to and is directed at a) persons who have professional experience in matters relating to investments falling within Article 19(1) of the Financial Services Act 2000 (Financial Promotion) Order 2005 or (b) high net worth entities, and other persons to whom it may otherwise be lawfully be communicated, falling within Article 49(1) of the Order (all such persons together being referred to as “relevant persons”). The investments to which this document relates are only available to and any invitation, offer or agreement to subscribe, purchase or otherwise acquire such investments will be engaged in only with, relevant persons. Any person who is not a relevant person should not act or rely upon this document or any of its contents. In the same way, the information contained in this document is intended for “eligible counterparties” and “professional clients” as defined by the rules of the Financial Services Authority and is not intended for “retail clients”. With this in mind, Westpac expressly prohibits you from passing on this document to any third party. In particular this presentation and any copy of it may not be taken, transmitted or distributed, directly or indirectly into the United States and any other restricted jurisdiction.

This document has been approved solely for the purposes of section 21 of the Financial Services and Markets Act 2000 by Westpac Banking Corporation London Branch and Westpac Europe Limited. Westpac Banking Corporation is registered in England as a branch (branch number BR000106) and is authorised and regulated by The Financial Services Authority. Westpac Europe Limited is a company registered in England (number 05660023) and is authorised and regulated by The Financial Services Authority. Westpac operates in the United States of America as a federally chartered branch, regulated by the Office of the Controller of the Currency and is not affiliated with either: (i) a broker dealer registered with the US Securities Exchange Commission; or (ii) a Futures Commission Merchant registered with the US Commodity Futures Trading Commission. If you wish to be removed from our e-mail, fax or mailing list please send an e-mail to This email address is being protected from spambots. You need JavaScript enabled to view it. or fax us on +61 2 8254 6907 or write to Westpac Economics at Level 2, 275 Kent Street, Sydney NSW 2000. Please state your full name, telephone/fax number and company details on all correspondence. © 2012 Westpac Banking Corporation.

Australian Official Interest Rates - Further to fall

Westpac Consumer Confidence index was released in July showing an improvement in Consumer Sentiment.

Finally we have some evidence that the Reserve Bank’s policy of cutting the official cash rate by 1.25% between November last year and June this year is starting to gain more positive traction with households.

However, this result is far from convincing and should not be interpreted that we can expect confidence to steadily return to more normal levels over the months ahead.

The Index is now 2% above its level in October last year prior to the beginning of the rate cut cycle. However it is still 4.1% below the reading in November last year when households responded positively to the first rate cut in November. Following that initial
positive response in November concerns around the international and domestic economic outlooks offset any positive impact of the rate cut in December. These ongoing concerns, particularly around the international economic outlook, continued to mute the impact of subsequent rate cuts in May and June. In fact, despite the cumulative cuts of 125bps we still have the situation that pessimists slightly outnumber optimists.

Over the month, households were probably buoyed considerably by the result from the Greek elections and the positive reception to the latest European leaders’ summit , averting, at least for the time being, a new crisis in Europe.

While the Reserve Bank did not cut interest rates further there was a strong 5.5% jump in the confidence of those respondents who hold a mortgage.

There was also some positive news around the domestic economy.Petrol prices are down by 7% since the last survey and have now fallen 13% since May. The Australian dollar rallied from 98¢ to 102¢ versus the US dollar, and the share market rose 2.7%.

All components of the Index increased in July. The sub-indexes tracking consumer expectations for economic conditions over the next 12 months and five years increased by 5.8% and 5.2% respectively. The sub-index tracking responses on ‘whether now is a good time to purchase a major household item’ rose by 1.1%.

Respondents were also more positive around their own finances. The sub-indexes tracking assessments of finances relative to a year ago improved by 4.6%; and the outlook for finances over the next 12 months improved by 3%.

However, disturbingly, the sub-index tracking respondents’ outlook for their finances over the next 12 months is still 9.4% below the level in October last year prior to the beginning of the Reserve Bank’s rate cut cycle.

The Board of the Reserve Bank next meets on August 7. It is our view that interest rates in Australia are still too high. In his Statement following the interest rate decision on July 3 the Governor described interest rates as “a little below medium term averages”. With the Australian dollar back above parity, despite lower commodity prices, and fiscal policy being quoted by the RBA to be contradictionary in the order of 0.75% – 1.5% of GDP financial conditions in Australia are mildly stimulatory at best. Although there are tentative signs of improvement emerging in some interest rate sensitive parts of the economy, these have yet to show a convincing recovery and remain vulnerable to renewed weakness. Mean while the threat from a deteriorating global economic outlook continues to build.

Not with standing these issues the recent rhetoric from the Bank indicates that it is in a ‘wait and see’ mind set. Accordingly, whilst we think it is likely that, as we saw in the first half of 2012, the Bank’s ‘wait and see’ approach will eventually evolve into further
rate cuts totaling 0.75%, our call that the next cut will come in August could prove to be too early. However, because we believe that Australia needs lower rates and much can happen, particularly in the international economy, we are comfortable
maintaining that view.

Sourced from Bill Evans -Chief Economist Westpac

Age Care Reforms Announced

On 20 April 2012, the Prime Minister and the Minister for Social Inclusion and Minister for Mental Health and Ageing, announced the ‘Living Longer Living Better’ plan, a 10-year plan beginning on 1 July 2012.

To make it easier for older Australians to stay in their home while they receive care, the Government will:

  • Increase the number of Home Care Packages- from 59,876 to almost 100,000     (99,669).
  • Provide tailored care packages to people receiving home care, and new funding for dementia care.
  • Cap costs, so that full pensioners pay no more than the basic fee.

To make sure more people get to keep their family home, and to prevent anyone being forced to sell their home in an emergency fire sale, the Government will:

  • Provide more choice about how to pay for care. Instead of a bond which can cost up to $2.6 million and bears no resemblance to the actual cost of accommodation, people will be able to pay through a lump sum or a periodic payment, or a combination of both.
  • Give families time to make a decision about how to pay, by introducing a cooling-off period.
  • Cap care costs, with nobody paying more than $25,000 a year and no more than $60,000 over a lifetime. This measure will not affect people already in the system.

To ensure immeditate improvements, the Government will also:

  • Increase residential aged care places from 191,522 to 221,103
  • Fund $1.2 billion to improve the aged care workforce through a Workforce Compact.
  • Provide more funding for dementia care in aged care, and more support for services.
  • Establish a single gateway to all aged care services, to make them easier to access and navigate.
  • Set stricter standards, with greater oversight of aged care.

Implementation of the reforms will be overseen by a new Aged Care Reform Implementation Council. The new reform package will be implemented in stages to enable providers and consumers to gain early benefits of key changes and have time to adapt and plan for further reform over the 10 years.

Home care

  • Home Care packages will increase from 59,876 to 99,669 over the next 5 years
  • Under new means-testing arrangements for Home Care packages, which will start from 1 July 2014, a consistent income test will be introduced. This will ensure that people of similar means pay similar fees – regardless of where they live – with safeguards for those who can least afford to pay.
  • The means test will not include the family home, which remains exempt.
  • People currently receiving a Home Care package will not be subject to the new arrangements while their current care continues.
  • In addition, to protect care recipients with higher than average care needs, an indexed annual cap of $5,000 for single people on income less than $43,000, and on a sliding scale of up to $10,000 for self-funded retirees, will apply to care fees. A lifetime care fee cap of $60,000 will be introduced.

Residential care

  • From 1 July 2014, the maximum accommodation supplement that the Government pays to aged care providers when people are unable to meet the cost of their accommodation will be increased from $32.58 to around $52.84 per day. As a result, the Government expect aged care places to increase from 191,522 to 221,103.
  • There will be more choice about how to pay for their care. Residents can pay for their accommodation in a lump sum, periodically, or a combination of both. A new cooling off period will mean that residents will not need to decide how they are going to pay until they have actually entered care.
  • From 1 July 2014, residential care means testing will be strengthened and improved. The treatment of the family home will not change from current arrangements.
  • An annual cap of $25,000 and a lifetime cap of $60,000 will apply to care fees.

Source: Hon Julia Gillard, Prime Minister & Hon Mark Butler, Minister for Social Inclusion & Minister for Mental Health & Ageing, Media Release.


Update on Debt Crisis in Europe

There has been increasing sharemarket volatility in recent weeks following the inconclusive election results in Greece.

What will happen next?
We believe that policymakers in Europe will be keenly aware of the lessons learnt from the financial crisis of 2008. Because of this, we do not necessarily believe that a disorderly Greek exit is a foregone conclusion.

Elections in Europe demonstrate that budget cuts or austerity will only ever be plausible so long as they have the support of the public. Voters in France, Italy and Greece have all unequivocally rejected the austerity at all costs approach so far in managing the crisis.

The French election has shifted the pendulum towards the possibility of a more lasting solution to the crisis - one that balances long-term structural reform, pro-growth policies and balanced budgets.

Greek exit not a foregone conclusion
While the last election in Greece saw voters resoundingly reject austerity, they equally rejected an exit from the Euro. A disorderly exit may be prevented by political will and the need to contain adverse outcomes for Europe and the rest of the world.

And, make no mistake, policymakers in the US and Asia will be tapping the shoulders of their European counterparts for an immediate and lasting solution. This may see Europe agreeing to fund Greece or a preplanned, orderly exit from the Euro.

What is the impact of the European crisis to the rest of the world?
The relative importance of Europe to Australia is small and declining – less than 10% of our exports go to the region. Asia is much more important and this dominance will only grow on record amounts of investment in the energy and resource sector.

The impact on China is also expected to be manageable. While Europe is China’s biggest customer for its exports, the recent slowdown in China has been driven primarily by higher interest rates to curb uncomfortably high inflation.

The US recovery is also continuing, and for Europe, Greece represents less than 3% of the European economy, implying that the crisis can be managed.

Given the potential escalation to Italy and Spain there is a common interest amongst all to put brinksmanship aside and implement a workable and lasting solution.

Interest rates and the AUD - twin support measures for Australia
If the European situation were to deteriorate Australian policymakers can rely on lower interest rates and a depreciating currency.

The RBA recently cut rates by 50 basis points, which is expected to support the non-resource economy, including retail sales and housing.

The Australian dollar will also track European concerns but the pace of depreciation has so far been much less than during the financial crisis in 2008.

The Federal Government also has scope to provide stimulus to the economy should there be a need to do so.

Things to consider
In periods of uncertainty many turn to cash or other strategies perceived to be safe. It is during these periods that investors all too often make decisions that are contrary to their long-term objectives.

While equity markets may well fall if Greece were to exit the Euro, it is important to also recognise that the global economy is still growing and global companies are making profits, paying back their debt and providing dividends to investors.

At the same time, the return on cash investments will decline on interest rate cuts. Bond markets look fully valued with yields near, or at, record lows for many developed economies.

During uncertain times long-term opportunities are most likely to emerge while equity markets remain below long-term valuations and policymakers may surprise markets, which could lead to a sharp turnaround in the price of equities.

Remember that frequent and undisciplined changes to your portfolio may lead to poor results. History has shown that missing just a few of the best months in equity markets may substantially reduce your overall return.

Note: Advice contained in this article is general in nature and does not consider your personal situation or needs. Please do not act on this advice until its appropriateness has been determined by a qualified adviser.  While the taxation implications of this strategy have been considered, we are not, nor do we purport to be registered tax agents. We strongly recommend you seek detailed tax advice from an appropriately qualified tax agent before proceeding.  The information provided is current as at May 2012.

Global Economy - A Little Less Scary

Introduction

The past few weeks have been interesting. Sovereign rating downgrades in Europe have intensified. The World Bank and now the International Monetary Fund (IMF) have slashed their growth forecasts for this year and warned of the risk of a global downturn worse than that associated with the global financial crisis. Yet share markets and other  risk trades  have almost said “ho-hum”. So what’s going on? Our take is the markets are telling us that a lot of the bad news has already been factored in. The ratings downgrades were flagged back in early December and the World Bank/IMF growth forecasts downgrades have only just caught up to private sector economists.1

This is not to say we are out of the woods, or that volatility will disappear. But it does seem the risk of a global financial meltdown has receded  somewhat and that the global economic  recovery appears to be continuing.

Europe – reduced risk of a financial blow-up Europe is on track for a mild recession  but the risk of a financial blow-up resulting in a deep recession  seems  to have receded  a bit. The provision of cheap US dollar funding by the US Federal Reserve and very cheap euro funding for three years by the ECB under  its long-term refinancing operations appears to have substantially reduced the risk of a liquidity crisis causing banking  collapses. It has also reduced pressure  on European banks to sell bonds in troubled countries.

We would have preferred the ECB to have directly stepped up its buying of bonds in troubled countries, but its back door approach has nevertheless seen a sharp expansion in the ECB’s balance sheet. In other  words, it appears to have embarked on quantitative easing, albeit it wouldn’t admit  it.

Reflecting this, bond yields in Spain, Italy and France and spreads to Germany – which were surging towards the end last year – have settled down. Similarly, European  bank stock prices appear to have stabilised.

This is not to say Europe is no longer a source of risk. It still is – it’s doubtful that even with the proposed debt restructuring Greece’s public debt is on a sustainable path, fiscal austerity is still bearing  down on growth across Europe, more ratings downgrades are likely and monetary conditions are still too tight. But the risk of a meltdown appears to have receded. What’s more European business conditions indicators have picked up in the last two months.

In November, we referred to three scenarios  for Europe:

1.  Muddle through – i.e. a continuation of the last few years of occasional  crises temporarily settled by last minute bare minimum policy responses.

2.  Blow up – in which a financial crisis and deep recession  see a break-up of the euro.

3.  Aggressive ECB monetisation – with quantitative easing  heading off economic calamity, albeit not quickly enough to prevent a mild recession.

Recent action by the ECB appears to have reduced the chance of the ‘Blow up’ scenario (probably to around 25%). The costs of leaving the euro for countries like Greece (which would include a likely banking  crisis as Greek citizens rushed to secure their current bank deposits,  which are all in euros, and default on its public debt anyway) still exceed the likely benefits, so it still looks like the euro will hang together. Overall, the most likely scenario  appears to be some combination of ‘Muddle through’ but with more aggressive ECB action preventing it from spiralling into a ‘Blow up’.


The US – no double dip (again)

During the September quarter a big concern was that the US economy would ‘double dip’ back into recession. This, along with escalating worries about Europe and the loss of America’s AAA sovereign rating, combined to produce sharp falls in share markets.  Since then, US economic data has turned around and surprised on the upside:

>   Retail sales growth has hung in around 7% year-on-year despite a sharp fall in consumer confidence

>   Jobs growth has picked up

>   Housing-related indicators have stabilised and in some cases started to improve, and

>   Gross domestic product (GDP) growth has picked up pace again after a mid-year softening.

Earlier concerns about a 1.5% to 2% of GDP fiscal contraction in 2012 dragging growth down have faded as Congress has agreed to extend payroll tax cuts and expanded unemployment benefits for another two months, with a good chance they will be extended for the full year.

More fundamentally, the US appears to be starting to enjoy somewhat of a manufacturing renaissance (in stark contrast to Australia!).  there are numberous anecdotes of global companies moving manufacturning to the US including Electrolux, Siemens, Maserati and Honda (which chose to build a new ‘super car’ in Ohio rather than in Japan). Furthermore, General Motors is now the world’s top selling car maker again. Could a decade-long fall in the US dollar and very strong productivity growth be sowing the seeds of a long-term turnaround in America’s fortunes?


China – so far so good

Chinese economic growth has slowed to 8.9%, but there is no sign of a hard landing. Export growth has slowed sharply but so too has import growth and in any case net exports have not been a contributor to growth in recent years. Moreover, retail sales growth has held up well and fixed asset investment has slowed only slightly.

Furthermore, falling inflation (from 6.5% in July to 4.1% in December) and a cooling property market, evident by falling prices in 52 of 70 major cities in December, and falls in sales and dwelling starts  provide authorities with the ability to ease the economic policy brakes. And there is plenty of scope to ease.   Large banks are currently required to keep a record high 21% of their assets in reserve, the key one-year lending rate is at 6.6%, the budget deficit was just 1.1% of GDP last year and net public debt is around zero once foreign exchange reserves of US$3 trillion and other assets are allowed for.

After doubling between October 2008 and August 2009 on global financial crisis related stimulus and a growth recovery, Chinese shares fell 38% to the low early this month as investors feared tightening policy would result in a hard landing.  With Chinese price to earnings multiples having fallen back to bear market lows and policy starting to ease again, decent gains are in prospect over the next few years.


Global growth

The next chart highlights the improvement recently in global economic indicators. Manufacturing conditions in most  major countries were in decline into the September quarter, but in recent months have either stabilised or started to improve.

What does this mean for investors?

None of this is to say it will be smooth sailing going forward. Europe’s problems are a long way from being solved, uncertainty remains regarding fiscal policy in the US, Chinese authorities will need to ease soon to ensure a soft landing and the Reserve Bank in Australia also needs to cut more. On top of this, after a solid start to the year shares are getting a bit short-term overbought, some short- term sentiment measures are a bit elevated and the hot and cold pattern of US data releases warns we may soon see a cold patch. So shares are vulnerable to a short-term setback (with February often a soft month in contrast to the seasonal strength seen in January).

However the improved global economic outlook and reduced tail risks regarding Europe suggests 2012 should be a better year for shares and other risk assets.  This is also supported by the fact that shares are starting the year well below year ago levels.

Signposts investors should watch  include: the size of any share market  setback  in the seasonally weak month of February; bond yields in Italy, Spain and France; the US ISM manufacturing conditions index; and Chinese money supply growth.

Dr Shane Oliver, Head of Investment Strategy and Chief Economist

AMP Capital Investors


PLEASE LEAVE A COMMENT/QUESTION BELOW


1 Our global growth forecast for 2012 is 3%, which compares to the IMF’s new forecast of 3.25% and the World Bank’s new forecast of 3.4% (if purchasing power parity weights are used to combine  countries).


Note: Advice contained in this articler is general in nature and does not consider your personal situation or needs. Please do not act on this advice until its appropriateness has been determined by a qualified adviser.  While the taxation implications of this strategy have been considered, we are not, nor do we purport to be registered tax agents. We strongly recommend you seek detailed tax advice from an appropriately qualified tax agent before proceeding.  The information provided is current as at January 2012.


Why It's So Important To Have Essential Fatty Acids As Part Of Our Diet

What are Essential Fatty Acids and why are they so important in our diet?

Essential Fatty acids (EFAs) are the “good fats” and are necessary fats that humans cannot synthesize, and must be obtained through diet. There are 2 families of EFAs: Omega 3 and Omega 6.

Western diets are deficient in omega-3 fatty acids, and have excessive amounts of omega-6 fatty acids compared with the diet on which human beings evolved and their genetic patterns were established.

Good fats compete with “bad fats”, so it’s important to minimize the intake of cholesterol (animal fat) while consuming enough good fats. Also good fats raise your HDL or “good cholesterol” one of the jobs of your good cholesterol is to grab your “bad cholesterol” (LDL), and escort it to the liver where it is broken down and excreted. In other words these good fats attack some of the damage done by the bad fats. This is very important in an age when so many people in the Western world are struggling to get their cholesterol down, and fight heart disease and obesity.

EFAs support the cardiovascular, reproductive, immune, and nervous systems. The human body needs EFAs to manufacture and repair cell membranes, enabling the cells to obtain optimum nutrition and expel harmful waste products. A primary function of EFAs is the production of prostaglandins, which regulate body functions such as heart rate, blood pressure, blood clotting, fertility, conception, and play a role in immune function by regulating inflammation and encouraging the body to fight infection EFA deficiency and Omega 6/3 imbalance is linked with serious health conditions such as heart attacks cancer, insulin resistance, asthma, lupus, schizophrenia, depression, accelerated aging, stroke, diabetes, arthritis, ADHD, and alzheimer’s disease, among others.

What foods provide omega-3 fatty acids?

Salmon, flax seeds and walnuts are excellent sources of omega-3 fatty acids. Very good sources include scallops, chia seeds, cauliflower, spinach, pumpkin seeds, brazil nuts, avocado, cabbage, cloves and mustard seeds. Good sources include halibut, shrimp, cod, tuna, soybeans, tofu, kale, collard greens, and Brussels sprouts.

It is important to note the EFAs are perishable, they deteriorate rapidly when exposed to light, air and heat so freshness is important.

There are many EFA supplements available including fish oil, flaxseed oil, cod liver oil etc, for more information consult your health professional.

This information is for general educational purposes only and does not replace individualized diagnosis and care.
Donald Rudin, MD, and Clara Felix. Omega-3 Oils; A practical Guide. US: Avery, 1996.
Andrew L. Stoll, MD. The Omega-3 Connection. New York: Fireside, 2001.

Protect Your Biggest Assest: Your Ability To Earn

Protect your biggest asset: your ability to earn

If your lifestyle is dependent on your ability to work, an extended period of absence through illness or injury could be devastating to you and those who are dependent on you.

Income protection insurance replaces your income up to the insured benefit amount of the policy. Most commonly the maximum cover is 75% of earnings (after business expenses, but before tax)

The waiting period can vary; it can be as short as 14 days or as long as two years or more. It is important to remember that benefit payments usually do not start immediately; a waiting period will apply during which no benefit is payable.

The maximum period of time that payments continue is called the benefit period. A range of benefit periods are available — some as short as one year, with the longest continuing through to age 65. Once benefits start, payments are usually made monthly in arrears.

Tax effectiveness - Premiums for income protection policies have the benefit of being fully tax deductible – a good way to protect yourself and reduce tax.

What are the alternatives? - Is this the insurance you have to have? It’s up to you of course, but consider some of the alternatives……….

Family assistance - You could rely on family or friends to help you but they’re likely to have their own financial obligations, and this may needlessly strain your relationship.

Savings - You could use savings in the short term to support yourself, but problems arise if your savings are not readily accessible or your incapacity is long term. You are also spending money that you’ve worked hard to save over an extended period of time.
Employer - You may be a valuable employee but your employer is unlikely to be able to continue paying you and find, train and pay your replacement.

Benefits - Workers’ compensation may help if your injury or illness is work related. Or social security may be available, if you meet the means tested eligibility criteria. In both cases, the benefit levels are unlikely to meet your needs.


Note: Advice contained in this flyer is general in nature and does not consider your particular situation or needs. If information contained is not appropriate to you at this stage please pass on to family and friends who may benefit. Please do not act on this advice until its appropriateness has been determined by a qualified adviser.

For more information on Income Protection Insurance or to arrange a no-cost, no-obligation first consultation, please contact: GEM Capital on Ph:8273 3222

What are the chances of being prevented from working as a result of a sickness or injury? More than 60% of Australians will be disabled for more than 1 month during their working life. More than 15% will be disabled for more than 3 months during their working life. Source: Institute of Actuaries Table IAD 1989-93 and ALT 90-92

Tribute to Peter Ruehl (who passed away on 11th April 2011)

Understanding Gillard is a Little Taxing (from the book Men are Stupid, Women are Crazy) – published on 1st March 2011 in the Aust Financial Review

When ‘s a tax not a tax? When Julia Gillard says it isn’t. At least that’s what she says about the carbon tax, you know, the one she said, just before the last election, that she would not bring in. So it’s not really a tax. It’s really just a little something Hallmark will be sending out to you to remind you to have a nice day and, by the way, give the government a bunch of your money.

I don’t know what you think about global warming, not having made up my mind about it myself. I mean, I know things are heating up in some parts of the world but I don’t know whether it’s my fault or whether it was going to happen anyway, sort of like the latest Charlie Sheen meltdown. But let’s say global warming is our fault. Well, not ours. It was our parents’ fault. They were the ones who were driving around in those big cars with leaded fuel. They were eating all that red meat from cows that broke wind all over the place and killed the ozone layer. But we should fix it up, right?

So we do it with a carbon tax. Gillard, by the way, has since recanted a little bit, or depending on your view, a whole lot of a real little bit. She now admits she said before the election that there wouldn’t be a carbon tax (nice to know she believes in videotape), but if I’m following her through this, she thinks the situation has changed. What’s changed? Have the polar ice floes reached Sydney? Are you starting to feel a little scammed here?

It reminds me of the time George H W Bush said “Read my lips: no new taxes. You can dress up and disguise a new tax any way you want, but people can spot one the minute you put it out there. Bush tried that trick. He was also a one-term president. Too bad, in a way, because overall he was a better president than his fruitcake son, who lasted two terms.

Gillard will probably get the tax through because it has the backing of the Greens and independents. The Greens never met an environmental tax they didn’t like, and the independents know they’d better go along because it wouldn’t take much to change governments and they’ve got enough trouble just showing up for work as it is. But that’s the high price you pay for having two of the loonier elements in politics propping up your government.

This must have been really comforting to Gillard: Kristina Keneally backed her stand on the carbon tax. Getting an endorsement from anybody in New South Wales Labor on anything is like having Lindsey Lohan appear as a character witness, but Kristina wanted everybody to know she thought it was a hot idea. Great. Any time that anybody from the New South Wales ALP comes up with a hot idea, about five people have to quit their jobs.

Keneally said that households should be compensated for the carbon tax. This is a great governmental solution to any problem that comes up (and that is, as is more often the case than not, a problem caused by the government). When in doubt, compensate. In other words, you’ve just proposed something a lot of people can’t pay for so you have to use your money to pay them to pay you. Makes perfect sense. After all, who’s going to be paying the wacky carbon tax; we’re also going to be helping the people who can’t pony up (and like the rest of us, shouldn’t have to anyway)

Fuel and electricity prices are going up. Retailers all over the country are singing the blues because they’re not hearing enough ka-ching, ka-ching. Now I not the time to be coming up with a new tax most people don’t completely understand to begin with. (Every time I think I’ve got a grip on it, somebody comes along, changes the subject and I have to start all over again.)

Weapons of Mass Destruction for Australian Economy? – The Greens

The 1st July 2011 marks a significant change in the formation of the Senate in Australian politics.  The balance of power in this house of Government now shifts to the Greens.

Leading Australian businessmen have voiced their concerns that the current Government is anti-business and that they are being dictated to by minority parties (including the Greens).  This sentiment is best captured by John Symonds, the founder of Aussie Home Loans who recently said “We’ve got a Government in limbo, dictated to by minor factions”.  Gerry Harvey from Harvey Norman called for a fresh election suggesting that the current state of the Government is contributing to poor consumer sentiment.

Usually investors do not have to concern themselves over politics, however given the circumstances Australia now finds itself in politically, we argue that investors must pay attention to this issue as it has the potential to influence investment outcomes.

Given that the Greens now arguably have greater influence over Federal politics, we thought it appropriate to examine some of what they stand for.

We have produced a table that outlines 10 of the Greens policy ideas, and included some of the risks to the Australian economy that each policy idea represents.


Policy Idea Potential Risk to Australian Economy


Limit Australian Banks ability to move interest rates for housing loans so that they can only move in line with official Reserve Bank rate movements (bill presented to parliament last year, supported by some of the Independants) During times when Banks have to pay more to buy funds to lend out to consumers like we have recently seen, would lead to housing lending becoming unattractive for banks.


This could lead to banks making less credit available for the housing sector, which in turn would most probably lead to severe stress in housing prices (but at least this would achieve one of the other policy agendas for the Greens which is affordable housing).


Consumer spending is also heavily influenced by state of the housing market.


There was an excellent article written on this issue at Greens Banking Bill article


Ensure all employees, including casual, fixed term and probationary workers, and employees of small business have the same rights to challenge termination of employment where it is unfair, with reinstatement to be the remedy except in exceptional circumstances.  (source www.greens.org.au)


Likely to provide disincentive for small business to hire staff.


Small business employ the majority of the workforce in Australia.


This could contribute to heightening unemployment in Australia.

Repeal any independent contractors legislation that strips employment rights from individuals (source www.greens.org.au)


Use of contractors is widely used in construction industry.


Employees rather than contractors makes a workforce less flexible, and arguably more expensive for business.


Probable result is increase in construction costs for housing, NBN, and other constructions.


Seems at odds with the Greens affordable housing idea.


Article on Contractors under attack


Legislatively protect the right to strike, as recognised in International Labour Organization conventions No. 87 and No. 98, as a fundamental right of workers to promote and defend their economic and social interests. (source www.greens.org.au)


Likely to lead to increased industrial action, which could result in businesses opting to run their operations from other countries.


Likely result is to increase costs for Australian business which could lead to business looking to locate more of their operations offshore


Limit the tax deductibility of any executive salaries to 25 times the minimum full-time adult wage (source www.greens.org.au)


Arguably one of the reasons the standard of our political leaders is relatively poor, is that they are poorly paid when compared to leadership positions in the private sector.


This could lead to Australia’s top business leaders being enticed away from Australia and Australian business being run by poorer quality management.  This in turn could lead to lower returns for investors from Australian companies.


Abolishing the 30% Private Health Insurance Rebate in order to increase funding for public hospitals (source www.greens.gov.au)


Private system is already overstretched.


Removing the concessional arrangements for Capital Gains Tax (source www.greens.org.au)


Disincentive for people to invest in assets that grow in value such as shares, property and businesses.


Asset values could fall, fewer people start businesses as incentive removed to build assets.


Oppose any increase or extension to the GST (source www.greens.org.au)


One of the benefits of GST is that all those who consume goods or services, pay tax.  Even those who operate in the cash economy end up paying tax when they spend money.


It has broadened the tax base for Australia and while we are not necessarily supporting an increase in GST, we would question the wisdom of removing this as an option to increase Government revenue in a broad way if required in the future.


Could lead to further complexity in the tax system as new taxes are introduced to bolster revenue.


Increase the Company Tax Rate to 33%

(source www.greens.org.au)


Reduces company profits, which reduces shareholder returns (virtually all Australians own shares directly or through their super funds).


Conduct a full review of the superannuation system with the aim of reducing its complexity and establishing progressive rates of superannuation taxation. (source www.greens.org.au)


Peter Costello removed much of the complexity from the superannuation system in 2006.


Is this code for increasing taxation on superannuation savings, particularly for those who would be considered as self funded and considered “well off”.


It would seem apparent that several of the Greens policy ideas are already influencing the current Government’s policy positions.

The Greens until now have not really had to stand up to scrutiny over their policies as they have never been in a real position of power.  That has now changed and it is appropriate that the Australian public pays close attention to the effects of what some of the outcomes are likely from what this political party stands for.

There is concern that there are many unintended consequences of the policies being promoted by the Greens, that could not only effect investors, but all Australians.  The purpose of this article is to put the spotlight on some of these policies so that informed choices can be made for the good of Australia.

As One Nation discovered, it was relatively easy to be anti policies of the day, but they did not stand the test of scrutiny when they began to develop policies of their own.  We are about to see how the Greens fare now that they are in a position where they too have to develop policies that reach well beyond the environment.

This article has been written by Mark Draper, and do not reflect views of the dealer group.


Note: Advice contained in this articler is general in nature and does not consider your personal situation or needs. Please do not act on this advice until its appropriateness has been determined by a qualified adviser.  While the taxation implications of this strategy have been considered, we are not, nor do we purport to be registered tax agents. We strongly recommend you seek detailed tax advice from an appropriately qualified tax agent before proceeding.  The information provided is current as at June 2011.