Master of the market shares his success secrets

What should you expect from a Value Manager?

  • Resilience in falling markets
  • Reasonable capital growth in rising markets
  • Consistent dividend income
  • Low volatility
  • Tax effective

Master of the market shares his success secrets
Anton Tagliaferro has risen to the top by sticking to the basics
The Australian: Business - 22 June 2011
IML Investment Director, Anton Tagliaferro was featured in The Australian, the article has been re-published below:

It was 1998 and the Australian investment community was in the grip of the tech boom. An emerging fund manager named Anton Tagliaferro, who was ready to make his mark on Australia’s funds management industry, had just established his own firm, Investors Mutual. But unlike most fund managers, a young Tagliaferro was unconvinced about the tech-boom hype and instead stuck with traditional companies that had a performance history. The decision would be costly because his performance took a hit and the period until 2000 became one of the darkest of his professional career. He describes that tumultuous period, which is documented in the book Masters of the Market, as “one of the worst things I’ve had to live through in my professional career”. Tagliaferro even doubted if his business would survive. “I just didn’t know what to do,” he says in the book. “I had just set up a business. We only had $300 million under management and our clients were really unhappy. I had people pulling money out because our returns were bad.” It was during this period that Tagliaferro bought an annual pass to the Sydney Aquarium. “I used to go down there at lunchtime and stare at the fish in the big tanks and think maybe my time was up,” he says But the tide turned. The tech sector collapsed in 2000 and Tagliaferro was among the few fund managers to emerge unscathed. Two years later, IML was awarded the fund manager of the year for Australian equities by MoneyManagement, and today, Tagliaferro is considered one of the greatest in Australia’s funds management industry.

But it’s a description that does not sit easily with him. “There are lots of good people in the industry,” he says. “I think that I’ve been fortunate that I’ve always had a very conservative investment policy at a time when there have been speculative bubbles in place. Wilson Asset Management founder Geoff Wilson, who co-wrote Masters of the Market, says Tagliaferro has been a “phenomenal success story”. “He’s grown a business from nothing to $3.5 billion (in funds under management) in 13 years.” Tagliaferro is equally known for this straight-shooting style and is not afraid to tell company directors or politicians like it is.
Paradice Investment Management founder David Paradice says Tagliaferro has been influential in the funds management industry and his “strong views” have changed the outcomes for a lot of companies. “He doesn’t suffer fools lightly; I think that’s a very good quality,” Paradice says.

Tagliaferro takes the view that shareholders are the owners of the company and management is there to work for shareholders. “I know a lot of fund managers take the view that if they don’t like what’s going on, they just quit the register and sell,” he says. “We take the view that we are the owners of the company, so if the company is fundamentally a good company and it’s just a matter of changing or influencing the direction of management, we’ll do what we can to achieve that.”

As the topic turns to the shape of corporate Australia, there is no mincing of words. “I think the environment is fairly tough at the moment,” Tagliaferro says. “There’re all sorts of pressures on companies apart from the currency being where it is, interest rates going up (and) clearly a government . . . whose policies are not often that economically transparent but seem to be more politically driven like the carbon tax. There are no free kicks anymore for companies; they have to really earn their living now.”
He is equally blunt about the carbon tax. “For Australia to go it alone on a carbon tax is a little bit naive,” he says. “It is . . . making it very disadvantageous for many of our companies to operate when you are putting things on like carbon taxes which don’t exist overseas.
“When you consider Australia only consumes something like around 80 million tonnes of coal a year and China consumes over 3 billion tonnes of coal, it seems a little bit ludicrous to be worried about changing the world’s temperature or whatever we are trying to do when we are such a small part of the global environmental problem.”

Tagliaferro also sees “major risks” to the Australian economy. “The currency, where it is, is making it very tough for many industries,” he says. “Interest rates: you could argue that the RBA has already pushed them up too far. “Politically we have all these different decisions being made, which sometimes seem to be more politically motivated than economically rational.”
He says unless we are careful, “we could be going into a downturn in Australia”.

Tagliaferro says in the past two years, IML has positioned its portfolio away from cyclical stocks. “We haven’t got any discretionary retailers like JB Hi-Fi or Harvey Norman,” he says.

“We don’t own any very cyclical manufacturing stocks like Bluescope Steel; we’ve stayed away more or less from media companies like Fairfax and Ten Network. We have really tried to focus on companies that we think can continue to grow and deliver and do reasonably well in what is a fairly . . . difficult environment for corporates.”

Australian Share Market - How can you tell if it's cheap?

There are many ways of measuring value in the share market, but today we will concentrate on two.

1. Price Earnings Ratio

The Price Earnings ratio (PE) measures the share price divided by the earnings of a company.  If Company A had a share price of $1-00 and had earnings per share of $0-10, then the PE multiple would be 10.  If the share price however doubled to $2-00 while the earnings remained the same, then the PE multiple would be 20.

There is no hard and fast rule about PE ratios, but clearly the higher the PE ratio, the more expensive the company.  Of course a company that is growing its earnings quickly may look expensive today but as earnings grow the PE multiple reduces assuming the share price remains unchanged.  For example Company A with a share price of $1-00 and earnings of $0-10 per share, doubles its earnings to $0-20 per share now has a PE multiple of 5.

2. Dividend Yield

The dividend yield is simply a percentage of income that is paid to investors from a share in a company.  It is calculated by dividing the dividend paid by the share price x 100.  For example Telstra pays a 28 cent dividend and assuming a share price of $4.50 represents a dividend yield of 6.22% (0.28/4.50 X 100).  When the Telstra share price was around $3 it was still paying a dividend of 28 cents per share, which equated to a dividend yield of 9.33%.  This does not include the benefit of imputation which is discussed elsewhere.  A simple way of looking initially at dividend yield is that the higher the yield the better the value.

Investors need to determine whether a dividend is sustainable by looking at what percentage of company profits is paid out as a dividend as well as the sustainability of profit levels.  For example a company that pays out 90% of its profits as a dividend may not be able to sustain its dividend, particularly if profit falls, versus a company paying out 70% of its profits as a dividend.

Dividend alone is not a determinant of value as many companies reinvest heavily back into their business rather than pay higher dividends to investors.  That said when considered across an entire market, dividend yield provides some clue as to whether a market is cheap or expensive (ie a higher dividend yield implies the share price is cheaper, while a lower dividend yield across a market implies share prices are more expensive)

We caution investors in attempting to value shares using only one method as there are many other aspects that should be considered.  However on two of the more commonly used valuation methods, the Australian share market appears attractively priced for investors.

This material has been provided for general information purposes and must not be construed as investment advice. This material has been prepared without taking into account the investment objectives, financial situation or particular needs of any particular person. Investors should consider obtaining professional investment advice tailored to their specific circumstances prior to making any investment decisions and should read the relevant Product Disclosure Statement.

Shares And The Long Term

Introduction
A few weeks ago, after producing a graph showing shares outperform cash and bonds over the long term, I was asked a question along the lines of  “if shares outperform other asset classes over the long term, how come over the last decade equity-dominated balanced funds (which returned  4.5% per annum [pa]) have underperformed cash (which returned 5.4% pa)?”. The same issue was alluded to in a recent Bloomberg observation that in the US, bonds have beaten shares over the last 30 years. While one can quibble over the details, given these observations it is natural to think maybe it’s time to give up on stocks and switch to cash and bonds.

Stocks do outperform over the long term
The first point to note is that over the very long term, shares have provided higher returns than cash or bonds. The next chart is the one referred to earlier and shows the total returns from Australian shares, bonds and cash from 1900. Despite numerous disasters along the way, such as the World Wars, the Great Depression, the stagflation of the 1970s, the 1987 share crash, a major Australian financial crisis in the early 1990s - A$1 invested in Australian shares in 1900 would have risen to A$287,087 by last month with a compound return of 11.9% pa. By contrast, the compound returns of 4.6% pa and 6% pa for cash and bonds would have seen A$1 invested in these assets rise to only a fraction of this.

Shares beat cash and bonds over the long term - Australia

Source: Global Financial Data, Bloomberg, AMP Capital Investors

It’s been a similar story in other comparable countries. Following is the same chart for the US. Not quite as impressive but still the same story.

Shares beat cash and bonds over the long term - US

Source: Global Financial Data, AMP Capital Investors

The long-term outperformance of stocks over bonds and cash is as would be expected – the greater riskiness of shares is rewarded with higher long-term returns.

However, even in the long term there is a cycle

The following chart shows a real accumulation index for US stocks since 1900. The trend line represents a real rate of return of 6.2% pa.
Whenever the index is rising faster than the trend line, stocks are providing above trend returns. Vice versa when it falls relative to the trend line.

Long-term bull and bear phases in US shares

Source: Global Financial Data, AMP Capital Investors

Long-term bull and bear phases are evident, and the bear phase over the last decade is not unusual. This pattern also exists in other countries. The following chart shows the rolling 10-year return difference between shares and bonds. Every so often shares have lengthy phases where they underperform bonds, e.g. in the 1930s, 1970s and more recently.

Shares periodically go through a decade or so where they underperform bonds

Source: Global Financial Data, AMP Capital Investors

This suggests that at any point in time, the experience of the past 10 to 20 years is no guide to the long term. An investor in US stocks at the end of the 1960s would have been wrong to project the above average returns of the 1960s into the 1970s (when actual real returns averaged -0.7% pa). Likewise the bad 1970s were no guide to the 1980s (when real returns averaged +11% pa). In other words 10 to 20 years is not the long term when it comes to shares. So the fact that US shares have underperformed bonds over the last decade doesn’t mean they will over the next.
In fact, what’s evident is mean reversion. 10 to 20-year periods with above-trend returns and above-average returns relative to bonds and cash tend to be followed by weak 10 to 20-year periods where returns are below trend. The table below shows the top performing asset classes (out of equities, bonds, cash and property) for each decade over the past century in the case of the US, the world and Australia.

Top performing asset classes by decade

Source: Global Financial Data, Dimson et al, AMP Capital Investors

The 1982-2007 bull market in Australian shares arguably spoilt investors and we have simply forgotten that the superior longterm performance of shares comes with a cost, which is that there are sometimes lengthy periods during which shares can perform poorly.

The 10 to 20-year return cycle in shares reflects fundamentals.

It’s no guide to the ‘long term’. The 10 to 20-year secular cycle in shares appears to reflect a combination of factors including:

  • Starting point valuations – US share prices were high relative to trend earnings (i.e. the price-to-earnings ratio) in 1929, the late 1960s and in early 2000 (after which followed the secular bear markets of the 1930s, 1970s and 2000s) and low in 1949 and 1982 (after which followed two decades of strong returns);
  • Underlying economic developments – depression in the 1930s and inflation in the 1970s were bad for shares, whereas solid economic growth, disinflation, economic rationalism, globalisation etc. in the 1980s and 1990s were great for shares. Right now it’s deleveraging in the private and public sectors in the US and Europe which is proving to be bad for stocks.
  • Technological innovation – rapid technological innovation helped push stock returns above trend in the 1920s (electricity, mass production), 1950s (petrochemicals, electronics) and 1990s (IT).

Perhaps the most important point is that the starting point matters. Ten years ago US stocks were offering a dividend yield of just 1.5%, but the 10-year bond yield was 4.6%. This made it much easier for bonds to outperform shares as indeed they have over the last decade. But it’s now going to be harder for bonds to outperform over the decade ahead as their yield has fallen to less than 2% whereas the dividend yield has increased to 2.2%. This is still low, but even if share prices do nothing over the decade ahead, shares will outperform bonds. Likewise in Australia, 10-years ago bond yields were 5.6% and dividend yields were just 4.3% so it was comparatively easy for bonds to do well. Today though, bond yields are 4.2% and the grossed up dividend yield is 6.8%. In other words, it’s currently easier for shares to outperform bonds over the decade ahead as bond yields are quite low relative to dividend yields. This is also highlighted in Australia with the dividend yield grossed up for franking credits now running well above bank term deposit rates which are now falling. In fact, on this basis the grossed up dividend yield of 6.8% compared to term deposit rates of around 5.5% imply shares are paying out 1.3% more cash per annum than term deposits.

The Australian dividend yield is up, deposit rates are down

Source: RBA, Bloomberg, AMP Capital Investors

Concluding comments
The historical record suggests:

  • Over the very long term stocks do outperform most other asset classes;
  • However, there are 10 to 20-year periods over which this is not necessarily the case. In this context the recent experience in share markets is not unusual; and
  • The outlook at any point in time in part depends on the starting point. After a decade or so of above-average returns a period of slower returns is likely, and vice versa.

The long-term cycle in equity markets should clearly be allowed for when setting investment strategy for individual investors. While 10 years might not seem long for me, it is very long for my mother. So, as discussed in a recent note, an outcome or absolute return investment approach may be appropriate for those with a short-term investment horizon or specific investment needs. However, for those with a longer-term investment horizon it’s worth bearing in mind that in an historical context, the turbulence in share markets in recent years is not unusual and doesn’t tell us shares won’t provide superior long-term returns going forward. This is particularly so with dividend yields on shares rising at a time when yields on bonds, cash and term deposits are falling.

Dr Shane Oliver
Head of Investment Strategy and Chief Economist
AMP Capital Investors


Australian Shares, what next for 2012

With memories of 2008 and talk of a lost decade, many investors have questioned their views on long term investing. But earlier generations of investors faced similar worries – and today’s headlines echo the past with stories about government spending, inflation, oil prices, economic stagnation and high unemployment. And as this information aims to show, those investors who were patient prevailed in difficult times.

While not attempting to predict the future, history has had an interesting habit of repeating itself.

We reflect on the Australian Share market which has just endured two consecutive years of negative performance, and note that it has never experienced three consecutive years of negative returns in the last 100 years. Only 4 times in history has the Australian Share Market had negative returns in two consecutive years.

We now highlight those times, and in particular draw attention to the year following those two consecutive years of negative returns.

1929 -3.6%
1930 -28.1%
1931 +20.0%

1951 -3.3%
1952 -11.8%
1953 +14.8%

1973 -23.3%
1974 -26.9%
1975 +62.9%

1981 -12.9%
1982 -13.9%
1983 +66.8%

Information courtesy of AXA Australia – sourced from the All Ordinaries Accumulation Index


PLEASE LEAVE A COMMENT/QUESTION BELOW


Note: Advice contained in this articler is general in nature and does not consider your personal situation or needs. Please do not act on this advice until its appropriateness has been determined by a qualified adviser. While the taxation implications of this strategy have been considered, we are not, nor do we purport to be registered tax agents. We strongly recommend you seek detailed tax advice from an appropriately qualified tax agent before proceeding. The information provided is current as at January 2012.

International Shares attracting Institutional Attention

International equities have been a recent disappointment to Australian investors. Relatively speaking, Australian equites have performed significantly better due to a range of factors such as the local market’s limited exposure to IT (post the tech bust), the strength of our economy, the steady rise of the Australian dollar against the greenback and a preference for the ‘safety’ of a known market compared to more tumultuous overseas investment battlegrounds.

“In addition, macro concerns such as the European debt crisis, spiraling US debt levels, rising raw materials and energy costs as well as the confluence of socio-political events such as the Japan earthquake and the Middle East turmoil have added to investors’ worries,” adds Brent Puff from American Century Investments.

But there are signs that international equities are coming back into favour thanks, in part, to some of the reasons why investors have recently stayed away from them.

Lonsec Senior Investment Consultant Lukasz de Pourbaix says institutional investors in particular have shown greater interest in the sector thanks to improving fundamentals in the US market. “A lot of companies have undertaken cost-cutting measures with top line earnings expected to improve,” he says. “Future growth expectations and valuations are reasonable.”

Advisers, de Pourbaix notes, need a little more convincing. “I wouldn’t say they’re increasingly allocating to the sector,” he says. “For planners and investors getting into the market post the tech bubble, their experience has been that Australian equities have outperformed.”

It might not be too long, however, before more advisers start capitalising on the opportunities international equity exposure can bring. BT Financial Group Chief Investment Officer Piers Bolger believes a decline in the allocation to global equities has stabilised because of the “advent of hedged global equity products that have allowed advisers to better position client portfolios”.

He agrees with de Pourbaix that an ever-improving outlook for the global economy is restoring confidence. “This should assist global corporate earnings, with the potential for higher earnings relative to Australian corporates,” Bolger says.

Valuations for high-quality international companies also add to the compelling case for international equities. Tim Meggitt, Zurich Investments Head of Key Accounts and Research, notes, "We’re beginning to see further increases in exposure to global equity markets across a range of clients’ portfolios as they begin to understand the strong valuations that they can source from most of the larger economies."

The high Aussie dollar, once a deterrent for international equity exposure, is now working in its favour, giving internationally-positioned investors more purchasing power. Should the dollar dip (and as Meggitt says “it’s unlikely the Australian dollar will perform as strongly as it has in recent times against the US dollar”), unhedged investors will receive a boost. Adds Bolger, “The return for local investors may also be higher if the Australian dollar depreciates somewhat over time.”

A word of warning, though, from Bolger, focus on the fundamentals not just the “buying opportunity”. He says “The issue is what negatives are there that will impact on the return of the underlying investments?

“However, if the broader macro outlook continues to improve and both developed and emerging markets move higher, combined with a weaker Australian dollar from its current levels, global equity returns for investors could be higher relative to other investments.”

A little good news from overseas markets will do a lot of good for the sector, according to de Pourbaix, “There are still issues in Europe and the US in terms of debt but if you have a period where the macro environment stabilises combined with solid returns, there will be more interest in international equities.”

For Puff, corporate earnings will be the “linchpin” to the sustainability of stock market gains. “We remain constructive on future earnings growth although we are watching the impact of rising costs on earnings. To date, most companies have been very successful in addressing higher input costs in various ways such as increasing prices outright to offsets via productivity improvements,” he says.

“Finally, stock market valuations have not risen to extreme levels and continue to appear inexpensive relative to historical trends and to global bonds. We remain comfortable with the prospects of international equities over the medium to long term.”


Note: Advice contained in this articler is general in nature and does not consider your personal situation or needs. Please do not act on this advice until its appropriateness has been determined by a qualified adviser.  While the taxation implications of this strategy have been considered, we are not, nor do we purport to be registered tax agents. We strongly recommend you seek detailed tax advice from an appropriately qualified tax agent before proceeding.  The information provided is current as at June 2011.


Is the January barometer providing an early warning for 2016 returns?

Paul Docherty, University of Newcastle

So far, it has not been a happy new year for equity market investors. The Australian equity market lost A$100 billion in market value in the first week of trading, mirroring a dire global trend.

If we are are to believe the “January barometer”, things may be about to get worse. The January barometer is based on the belief that when the equity market ends in the black for the month of January, the subsequent year will be prosperous for equity markets, while a negative equity market return in January signals a bearish year for stocks.

The barometer was first devised in 1972 by the editor of the Stock Trader’s Almanac, Yale Hirsch. Hirsch claimed that January returns could accurately predict subsequent equity market returns in 91.1% of years, with the rare failures of this indicator being explained by extreme events such as wars.

If the January barometer were as accurate as has been suggested then this indicator would provide a boon to investors who could use the signal to make asset allocation decisions for the subsequent year. Unfortunately financial markets are like discount airlines; there are no free lunches. Competitive market forces result in investors exploiting, and therefore eliminating, any opportunities to make risk-free abnormal profits.

The weight of academic evidence now shows that the evidence used to justify the January barometer was a statistical anomaly. The result does not appear to hold when a longer sample of years are analysed and there does not appear to be any evidence to support the January barometer outside of the US.

An examination of returns on the Australian equity market from 1974 to the present provides a further rebuttal to January barometer. The figure below provides annual average returns across the subsequent eleven months for years in which the return in January is positive and negative respectively.

Data used to create this chart was sourced from Datastream.

As shown in this figure, the average equity market return in years following a negative January return (5.8%) is actually marginally higher than average returns in years following positive January returns (5.6%).

Recent history is also informative. In 2014 investors had a similarly unhappy start to the year, yet the market subsequently rebounded and ended the year in the black. Last year the market was up 3.2% in January, yet fell by 6.5% over the subsequent eleven months.

It is therefore clear that January returns are not a magic bullet that can be used to forecast stock market performance and make investment decisions. Financial markets are too sophisticated for individual monthly returns to be informative about the future. To borrow a quote from Mark Twain:

“October. This is one of the peculiarly dangerous months to speculate in stocks. The others are July, January, September, April, November, May, March, June, December, August, and February.”

Given the January barometer does not have merit as a forecasting tool, many investors will be anxious to know what lies ahead. Recent stock market declines can be attributed to structural problems across global economies. Chinese growth is continuing to weaken and global debt has increased significantly following a sustained period of low interest rates.

Ongoing global security threats were also identified as a potential limit to economic growth at the G20 summit last year. While predicting the direction of stock market returns across 2016 is fraught with danger, the current uncertainty across global markets appears to indicate that whatever the end result, investors are likely to be in for a volatile ride.

The Conversation

Paul Docherty, Senior Lecturer, Newcastle Business School, University of Newcastle

This article was originally published on The Conversation. Read the original article.

Dick Smith is the greatest Private Equity heist of all time

We have reproduced this article from Forager Funds - originally written by Matt Ryan - it's a good lesson on the dangers from buying assets from Private Equity firms. 

Want to know how to turn $10m in to $520m in less than two years? Just ask Anchorage Capital. The private equity group has pulled off one of the great heists of all time, using all the tricks in the book, to turn Dick Smith from a $10m piece of mutton into a $520m lamb.

Having spent the morning poking through the accounts, we’re going to show you how it all happened.

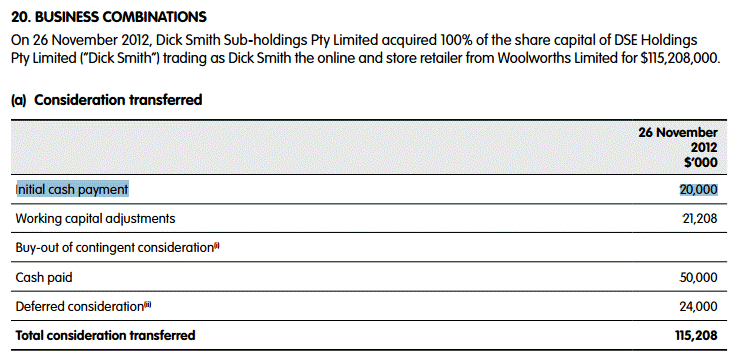
Firstly, Anchorage set up a holding company called Dick Smith Sub-holdings that they used to acquire the Dick Smith business from Woolworths. They say they paid $115m, but the notes to the 2014 accounts show that only $20m in cash was initially paid by the holding company.

dsh_1

It doesn’t look like they even paid that much, because they acquired the Dick Smith business with $12.6m in cash already in it. Dick Smith Sub-holdings was formed with only $10m of issued capital and no debt, and that is most likely Anchorage’s actual cash commitment.

So if Woolworths got paid $115m and Anchorage only forked out $10m, where did the rest of the cash come from?

The answer is the Dick Smith balance sheet, and this is always the first chapter in the private equity playbook: pull out the maximum amount of cash as quickly as you can.

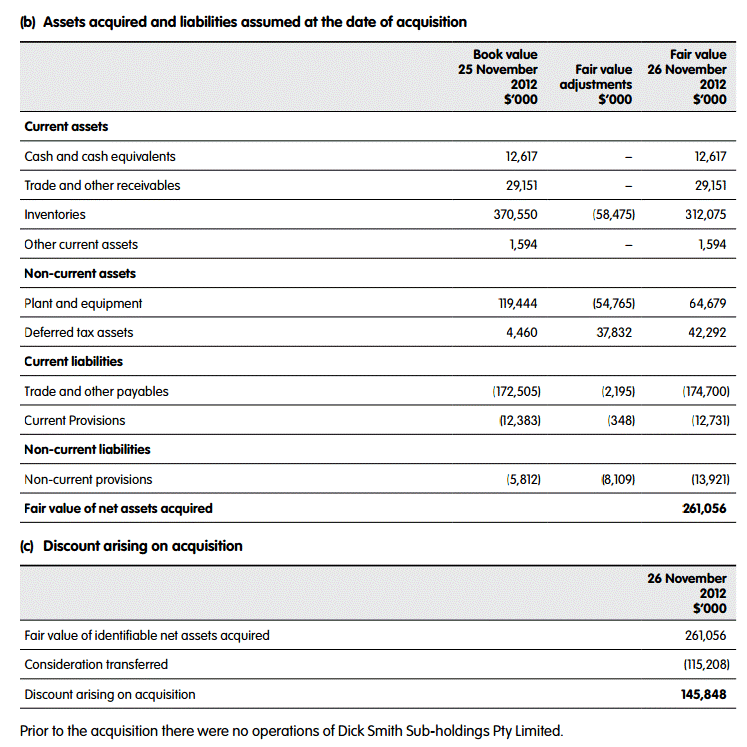
In this case, first they had to mark-down the assets of the business as much as possible as part of the acquisition. This was easy enough to do with a low purchase price. You can see in the table below, that $58m was written-off from inventory, $55m from plant and equipment, and $8m in provisions were taken.

dsh_2

The inventory writedown is the most important step in the short term. They are about to sell a huge chunk of inventory but they don’t want to do it at a loss, because these losses would show up in the financial statements and make it hard to float the business. The adjustments never touch the new Dick Smith’s profit and loss statement and, at the stroke of the pen, they have created (or avoided) $120m in future pre-tax profit (or avoided  losses).

Now they can liquidate inventory without racking up losses. And boy did they liquidate.

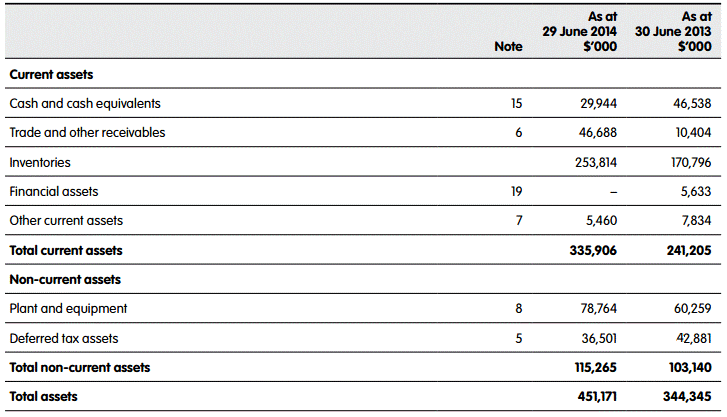
At 26 November 2012, Dick Smith had inventory that cost $371m but which had been written down to $312m. Yet by 30 June 2013, inventory has dropped to just $171m.

dsh_3

That points to a very big clearance sale, and the prospectus confirms that sales in financial year 2013 were exaggerated by this. The reduction in inventory has produced a monstrous $140m benefit to operating cash flow, basically from selling lots of inventory and then not restocking.

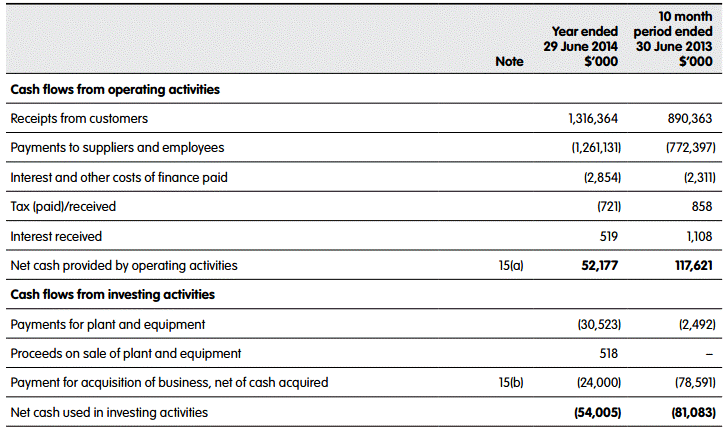
The cash flow statement shows that Anchorage then used the $117m operating cash flow of the business to fund the outstanding payments to Woolworths, rather than funding it from their own pockets (note that the pro-forma profit was only $7m during this period).

dsh_4

And that, my friends, is a perfectly executed chapter 1: How to buy a business for $115m using only $10m of your own money.

Chapter 2 involves selling a $115m business for $520m, and it’s a little more nuanced. The good news is that, while private equity are focused on cashflow, equity market investors aren’t really focusing on how much cash has been ripped out of the business. All they seem to care about is profit.

So the focus now turns from the balance sheet to the profit and loss statement, and it’s time to make this business look as profitable as possible in the year following the float (allowing them to sell it on a seemingly attractive “forecast price earnings ratio”).

The big clearance sale in financial year 2013 leaves them with almost no old stock to start the 2014 year. That’s a huge (unsustainable) benefit in a business like consumer electronics which has rapid product obsolescence.

Remember that marked down inventory? Most of it was probably sold by 30 June 13 but there would still be some benefit flowing through to the 2014 financial year.

Remember the plant and equipment writedowns? That reduces the annual depreciation charge by $15m. Throw in a few onerous lease provisions and the like, totaling roughly $10m, and you can fairly easily turn a $7m 2013 profit into a $40m forecast 2014 profit. That allows Anchorage to confidently forecast a huge profit number and, on the back of this rosy forecast, the business is floated for a $520m market capitalisation, some 52 times the $10m they put in.

Anchorage were able to sell the last of their shares in September 2014 at prices slightly higher than the $2.20 float price and walk away with a quiet half a billion. Private equity are renowned for pulling off deals, but if there’s a better one than this I haven’t heard about it.

Chickens home to roost

Of course, all of the steps taken above have consequences. By the end of 2014, inventory had increased to $254m, with new shareholders footing the bill for repurchasing inventory. This should have resulted in poor operating cash flow, but most of this was funded by suppliers at year-end, with payables increasing by $95m.

Come the end of 2015 financial year, however, it really comes home to roost. Operating cash flow was negative $4m, as inventory increases further and suppliers demand payment, decreasing accounts payable. The business is required to take on $71m in debt to fund a more sustainable amount of working capital. As the benefit of prior accounting provisions taper-off, profit margins fall, and the company reports a toxic combination of falling same-store sales and shrinking gross margins in the recent trading update.

Following a profit downgrade yesterday, the shares are now valued by the market at $0.77, and investors in the float are sitting on a 65% loss of capital from the $2.20 float price.

This float, as we pointed out in Dick Smith Takes A Bath, Comes Out Nice and Clean, smelled funny from the very beginning. Sorry Dick Smith investors, you’ve been had.

Bubbles and the corruption of risk

I have previously warned that the combination of the demographic avalanche of retiring baby boomers, low interest rates and a disproportionately large amount of their wealth in cash would mean that stocks and property would continue to rise for a while. I call it ‘The Boom We Have to Have.’ But like all booms, this one will also bust.

These conditions, especially low rates forcing a big part of the population into riskier products, corrupt investors’ sense of risk. Rising prices amid a wave of buying reinforces the behaviour of investors and their brokers who believe their thesis is correct.

New listings and credit point to problems

I am not alone in the view that at some point in the next six to eighteen months, there is a real chance that baby boomer retirement plans may sink thanks to their inability to avoid repeating the investment mistakes of their past. Stanley Druckenmiller is an American hedge fund manager, famous for being the lead portfolio manager for George Soros’s Quantum Fund. In 2010, Druckenmiller handed back the billions he had been managing for 30 years through his firm Duquesne Capital. He remains a noted philanthropist, keen golfer and speaker on the global investment and macroeconomic circuit.

Druckenmiller should be heeded. He observed that low rates have skewed peoples’ sense of risk, particularly in two markets – new share listings (IPO’s) and credit. He pointed out that 80% of companies listed in 2014 have “never made a dime”. In 1999, just before the tech crash, that number was 83%.

(As an aside, over the Christmas break, I read You Only Have To Be Right Once: The Unprecedented Rise of the Instant Tech Billionaires. Including Twitter, Facebook, Instagram, the book was a who’s who of the world’s biggest tech companies and the backgrounds to their stunning rises. But I couldn’t help noticing that all the references to billions had little or nothing to do with profits or in some cases even revenues. Some of the businesses discussed, which were sold for billions, not only had no revenue but no revenue model either).

Druckenmiller had another warning on credit markets. Last year, speaking on CNBC, Druckenmiller said, “When I look at credit … corporate credit is growing at a record rate, far faster than it grew in 2007. And S&P pointed out that 70% of debt issued has a B-rating or worse. To put that in perspective, in the ’90s, that number was 31%. Do you remember the hullabaloo in 2007 about covenant-light loans? Companies issued $100 billion of them in 2007, and 38% was B-rated. This year we’re going to $300 billion, up from $260 billion last year and $90 billion a year earlier, and 58% of them were B-rated.”

At the more recent speech, Druckenmiller also observed, “There are some really weird things going on in the credit market … but there are already early signs starting to emerge. And if I had a message out here, I know you’re frustrated about zero rates, I know that it’s so tempting to go ahead and make investments and it looks good for today, but when this thing ends … I think it could end very badly.”

Why is Druckenmiller so worried? It’s simple. If interest rates rise, many investors in corporate debt will want to exit at the wrong time. Australian investors in bank hybrids and corporate bonds (G8 Education is a recent example of a popular corporate bond issuer) should consider the warning too. And if interest rates don’t rise, but the economy weakens significantly, then some industries will be unable to cover their debt costs. Either way, investors will face problems at some stage.

Low rates support asset prices

Low interest rates are here to stay for a while and that will support asset prices. Eventually however the price of those assets (stocks and property) will be pushed way too high (we think a strong bull market is likely for some part of this year) as people panic buy amid a fear of missing out when their income is eroded from low rates on cash. After that, a large number of investors will, sadly, suffer financially again – from buying too late and paying too much.

There is a way to avoid it. You must be invested in high quality businesses with bright prospects and buy them when they are cheap. We can think of only a handful of stocks that meet this criteria currently. When we cannot find such opportunities, the only safe alternative is cash (even though rates are low) and we are 20-30% invested in cash at the moment.

If you are invested in a high-performing fund that is fully invested in stocks like REA Group (P/E ratio 44 times), Dominos Pizza (68 times), or many of the expensive stocks below, consider switching at least some of your retirement nest egg to a larger cash weighting. The cash won’t make your investment 100% immune to a declining market but it will allow additional purchases at cheaper prices, which offers the opportunity to significantly reduce the time to recovery. In Table 1, PER is Price to Earnings ratio.

Of course if interest rates stay at zero, the party could last a while yet, but as I have warned previously, be sure to be dancing close to the door in case you need to leave. Druckenmiller refers to a “phony asset bubble”, with a bunch of investors ploughing money into assets which will “pop”. Then we’ll see how many people are still enjoying the party.

Roger Montgomery is the founder and Chief Investment Officer of Montgomery Investment Management

The winners of a falling $AUD

Analysts now appear to be trimming their forecasts for the $AUD, with some now forecasting the dollar to fall below USD$0-80.


We have been talking about this for some time and remain of the view that the $AUD has further to fall.  Therefore we believe that it is not too late for investors to position themselves to profit from this.


From an investment perspective, Australian companies that have earnings coming in from overseas stand to benefit from a falling $AUD.  A lower $AUD results in their overseas earnings being worth more Australian dollars when converted using the lower currency.


Courtesy of Morgan Stanley, here is a list of major Australian companies which derive more than 30% of their sales from overseas.


Clearly we currently have a bias toward companies with overseas income, for more information and to highlight our best picks, please talk to your adviser.


This information is of a general nature only and neither represents nor is intended to be personal advice on any particular matter. We strongly suggest that no person should act specifically on the basis of the information contained herein, but should obtain appropriate professional advice based upon their own personal circumstances including personal financial advice from a licensed financial adviser and legal advice. Fortnum Private Wealth Pty Ltd ABN 54 139 889 535 AFSL 357306