Value in Commercial Property – Office Market Summary

In the lead up to the Global Financial Crisis, we did not invest in Listed Property Trusts or Unlisted Property Trusts.

With the significant realignment in these property markets we now are seeing value of investing in Commercial Property markets.

This article focuses on the Office market within the Commercial Property sector.

2010 saw the following occur in the Office market:

  • CBD Office vacancy rates peaked at 8.3% and are now trending down
  • Capital values increased by around 5%
  • There was tangible evidence of increased demand for space
  • Prime Gross Effective Rents increased by 1.4%

When considering a commercial property investment we normally would recommend investors seek the following in a property investment trust vehicle:

  • Vehicle should have High Quality Tenants of well known companies with strong brand names in a strong financial position.  The property vehicle should not overly focus on one tenant.
  • Consider the Average Lease Expiry (referred to as ALE) – this is the average term that tenants have to run before their lease is up for renegotiation.  A longer ALE should result in a higher income certainty for the investment vehicle
  • Level of Gearing – we would normally start to become uncomfortable with a property investment with more than 50% gearing
  • Investment vehicle should contain a number of properties in different locations, rather than relying on either one area, or worse still one property.


IMPORTANT INFORMATION:  Any advice contained in this article is general advice only and does not take into consideration the reader’s personal circumstances.  Any reference to the reader’s actual circumstances is coincidental.  To avoid making a decision not appropriate to you, the content should not be relied upon or act as a substitute for receiving financial advice suitable to your circumstances.  When considering a financial product please consider the Product Disclosure Statement

Australian Housing - is it about to crash?

Key points

  • Australian housing is still overvalued, leaving it, banks & the broader economy somewhat vulnerable. Undersupply provides some support but the two key threats are a Chinese hard landing and selling by investors.
  • The most likely scenario is many years of range bound house prices around a flat trend in real terms.
  • Right now house prices may slip a further 3% or so in the short term but lower mortgage rates are likely to lead to a bounce in prices from later this year/early next year.

Introduction
After the surge in Australian house prices from the mid 1990s into last decade my view was that while the risks of a sharp fall back in house prices were high, the most likely scenario was an extended period of range bound house prices in real terms. If anything most of the surprise has been on the upside – although not by much in real terms. But
despite the fears of many, house prices have not plunged like those in the US and elsewhere, despite a bigger boom.

However, the risks are rising again. Prices have slid 6% since their 2010 high and worries that the GFC is about to finally catch up with Australian housing are on the rise again. Excessive house prices and the excessive level of household debt that has come with it are Australia’s Achilles heal. Housing is 60% of household wealth and so movements
in house prices have a big impact on household financial well being and spending. Housing credit also amounts to 59% of total private credit so what happens to house prices is critically important to Australian banks. And as we have seen in Ireland and now Spain, what happens to banks can have a big impact on public debt levels.

Still overvalued, but not by as much

The bad news is Australian housing is still way overvalued. The good news is it is less so, with real house prices going nowhere for the last four years:

  • According to the OECD, the ratio of house prices to incomes in Australia is 28% above its long term average, putting it at the top end of OECD countries, although several other countries are more extreme. The US is now
    below its long term average on this measure.

  • According to the 2012 Demographia International Housing Affordability Survey, Australian housing trades on a median multiple of house prices to annual household income which is double that of the US. In Sydney, median house prices are $637,600 compared to $324,800 in Los Angeles. In Perth they are $450,000 compared to $159,500 in Houston, Texas.
  • However, it is apparent in the next chart that while real house prices are still above their long term trend, the divergence has narrowed to 13% from a peak of 33%.

Real house prices have now fallen back to 2008 levels.

  • Another way of looking at property valuations is to look at the ratio of price to rents (sometimes referred to as a PE ratio for housing) and adjust for inflation. On this basis Australian housing is still overvalued relative to its long term average by 10%, but at least this is down from a peak overvaluation of 38% in 2003.

The bottom line is while it may not be as stretched as was the case a few years ago, Australian housing is still overvalued. This combined with still high household debt to
income ratios leaves Australia vulnerable. Still undersupplied, but maybe not as much
One of the big supports for the Australian housing market is thought to be a shortage of housing with the National Housing Supply Council estimating a cumulative shortfall of
more than 200,000 dwellings. However, the just released 2011 ABS census wiped almost 300,000 off previous population estimates suggesting that the undersupply may not be as chronic as thought, and along with slowing population growth, has potentially reduced a support for house prices. Our assessment though is that while the undersupply of housing may not be as severe as thought, low vacancy rates still attest to some undersupply. And
Australia has not had anything like the residential property construction boom that the US had last decade, which accentuated the downwards pressure on its house prices. In Australia, housing starts and approvals are at cycle lows.

Where to from here?

Right now the Australian residential property market is chronically weak. Finance approvals & new home sales are depressed, first home buyer activity is subdued, prices are down, listings are up and auction clearance rates have been weak for 18 months. In fact, the failure of timely data like auction clearances to spring back into life despite mortgage rates starting to fall 8 months ago is a sign of how weak things are. Since the GFC, Australians have become fearful of taking on more debt and the once strongly held belief that house prices can only go up has long been ditched.

However, while fears are growing of a deep house price slump ahead, the most likely scenario remains a lengthy period of range bound house prices around a flat trend in
real terms. Just as we have seen nationally over the last few years and in Sydney since 2003. Essentially poor affordability, overvaluation and high household debt levels have put a cap on house prices whereas undersupply should limit their downside, within which, prices will cycle up and down in lagged response to falls and rises mortgage rates.

Australia did not experience the same deterioration in lending standards that occurred in other countries last decade. Home ownership rates didn’t increase. Most of the increase in mortgage debt went to older and wealthier Australians better able to service loans. And this has all been reflected in still low arrears rates of around 0.6%, and something like 50% of borrowers being ahead on payments.

Nevertheless, there are two key threats. First, a hard landing in China, resulting in a collapse in export earnings could drive unemployment sharply higher threatening a sharp risein delinquencies and forced sales. However, while this risk has increased given the threat from Europe, a sustained hard landing in China seems unlikely given China’s low
tolerance for social unrest and falling Chinese inflation.

Second, property investors who make up a third of housing debt may loose patience with the lack of capital growth and sell, leading to sharp falls in house prices. However, while it’s hard to see investors piling into residential property now, why would those who are already in suddenly sell now? Real estate investors are usually in there for the long term, made necessary by large transaction costs.

A third threat was coming from interest rates but with rates falling since last November, this has turned into a positive for the housing market. Affordability is still poor, but at least it’s improving and our assessment is that a further improvement in affordability lies ahead as interest rates are likely to fall another 0.75% by year end.

Bottom line – in the very short term house prices could fall a bit further as economic uncertainty continues to impact, but providing Europe doesn’t plunge China and the world into a renewed recession, falling mortgage rates are likely to drive a cyclical recovery in the housing market from later this year/early next. However, the most likely profile over the next 5 to ten years is for house prices to be stuck in a 10% or so range around a broadly flat trend in real house prices.

This is consistent with the 10-20 year pattern of alternating long term bull & bear phases seen in real Australian house prices since the 1920s. See third chart on page 1. The long
term bull phase of Australian house prices that started in the mid 1990s is now giving way to a long term bear phase.

Housing as an investment

After allowing for costs, residential property has historically provided a similar return over the long term to shares. This can be seen in the next chart, which shows an estimate of
the long term return from housing, shares, bonds and cash.

Since the 1920s, housing has returned 11.1% pa after allowing for capital growth and rents and shares have returned 11.4% pa after allowing for capital growth and dividends. While housing is less volatile than shares and for many seems safer, it offers a lower level of liquidity and diversification. Once the similar returns of housing and shares are allowed for there is a case for both in investors’ portfolios over the long term. Right now though, housing looks somewhat less attractive continuing to offer much lower yields. The gross rental yield on housing is around 3.7%, compared to yields of 7% on unlisted commercial
property, 6% for listed property (or A-REITs) and 6.5% for Australian shares (with franking credits). So for an investor, these other assets represent much better value.

This information is of a general nature only and neither represents nor is intended to be personal advice on any particular matter. We strongly suggest that no person should act specifically on the basis of the information contained herein, but should obtain appropriate professional advice based upon their own personal circumstances including personal financial advice from a licensed financial adviser and legal advice. RI Advice Group Pty Limited ABN 23 001 774 125  AFSL 238 429.

Assessing a Property Investment

I recently had a client ask me to assess the merits of an unlisted property trust offer that he had received - the name of the offer shall remain nameless, but I thought it would be interesting to walk you through the key reasons I advised to disregard the offer.

I must highlight that on the surface of it, the offer looked very attractive with a juicy rate of income of 9% pa and some lovely photos of the building with a well known listed company as the major tenant.

Firstly, the trust consisted of only one office building, so there was no geographic diversity. Add to this that 80% of the building was leased to one company and this means that investors are not only putting their eggs into one basket (one property), but almost totally relying on one tenant.

The tenant was a successful listed company, so we are not arguing that the company would go broke, but highlighted what would happen if that company wished to relocate into larger or smaller premises.  If this happened then virtually all of the income is vulnerable.

There were two other aspects that concerned us.  One was the average lease expiry which was only until 2016 - which means that the income from the property was only really secure until 2016.

Finally this property trust was an unlisted property trust which meant that in the event of an investor wanting to get their money back, for any reason, there is no mechanism to do this.

I thought this was an interesting exercise in the aspects we consider when deciding to proceed or "bin" an investment idea.

Mark Draper

This material has been provided for general information purposes and must not be construed as investment advice. This material has been prepared without taking into account the investment objectives, financial situation or particular needs of any particular person. Investors should consider obtaining professional investment advice tailored to their specific circumstances prior to making any investment decisions and should read the relevant Product Disclosure Statement.

The US housing sector turning the corner

Introduction

Starting with the bursting of the technology bubble in 2000, the fortunes of the US economy have waned.  Since then, the US has seen two recessions with the last being the worst since the 1930s, a rising trend in unemployment, the bursting of a corporate debt bubble with the tech wreck and the bursting of a housing debt bubble with the sub-prime mortgage crisis. So it’s little wonder  the US share market has been spinning its wheels  in a secular bear market. Some commentators even talk of a permanent decline for the US.

The high level of US public debt, ongoing private sector deleveraging,  less business friendly policies, demographic trends and the absence of extreme share market undervaluation suggest the secular bear market in US shares may not be over yet. That said, it would be dangerous to write the US off. Many did this in the 1970s only to see it roar back with vengeance in the 1980's and 90's .

More importantly, there are some signs of light at the end of the tunnel for the US in manufacturing, oil production and housing. This note takes a look at these sectors, focusing on the latter as housing was the original driver of the global financial crisis.

US manufacturing renaissance

Recently there have been numerous examples of companies setting up manufacturing plants or expanding production in the US over locations in Canada, Mexico, Japan or the emerging world. These include Maserati, Toyota, Honda, Nissan, Kia, Intel, Whirlpool and Caterpillar. In fact for the first time in over 35years, annual growth in manufacturing employment is exceeding employment growth elsewhere in the US economy. The key drivers of America’s manufacturing renaissance are restrained unit labour costs in manufacturing (which have been unchanged for the past 30 years), rising wages in emerging countries, the low US dollar (US$) after a decade long slump, and cheap energy prices helped  by surging natural gas supply. While it’s early days yet, America’s manufacturing renaissance has further to go.

Surging oil production

US natural gas supply has been surging for years resulting in low prices. More significantly, a few years ago US oil production quietly bottomed and is now on the rise again thanks to a surge in shale oil production. The US has huge reserves of shale oil and advances in fracking technology (by which shale kilometres below the surface is fractured  using explosives, allowing oil to be released and flow to the surface) and oil prices around US$100 per barrel are making it economic for these reserves to be tapped. Some even see the US becoming self sufficient in oil again in the decades ahead.

US housing bottoming

A collapse in the US housing sector was at the core of the sub- prime mortgage crisis in the US which subsequently morphed into the global financial  crisis. US house prices and housing construction surged into the middle of the last decade as lax lending standards underpinned a huge surge in home ownership. Boom turned to bust, starting around 2006 as housing supply started to surge and it became harder for sub-prime borrowers to refinance their loans. Foreclosures rose, made worse in turn  by rising unemployment as the whole process fed on itself. The subsequent slump has seen a 34% plunge in house prices. This has seen the volume of private residential investment collapse by about 60% from its peak in the mid 1990s, resulting in a huge  drag on US gross domestic product (GDP) growth.

Why the worst is likely over for US housing

There are good reasons to believe that the US housing market  is bottoming and starting to recover.

The first thing to note is that most  US housing indicators have stabilised. Home sales have been bouncing along a bottom since 2009. Housing starts  and permits to build new houses have been bottoming since late 2009. Furthermore, the National Association of Home Builder’s conditions index has now broken out on the upside, pointing to a rise in starts ahead. 

Second, the number of vacant homes is now starting to fall sharply. Over time the equilibrium number of vacant homes has increased in line with the rising population. This is proxied by the long-term trend line in the next chart. It can be seen that the gap between the actual number of vacant homes and its long-term trend is now closing rapidly. Related to this, household formation is likely to rise sharply. Since 2006 it has been running well below that implied by population growth and has collapsed  from a record 2 million to around 700,000 last year. This reflects  tough economic conditions causing young people to stay at home  with their parents for longer and is likely to rebound as economic  conditions improve. If the number of vacant homes continues to decline at the same rate as the last couple of years and household formation picks up then  the overhang of housing will likely be gone by year end.

Third, the stock of unsold new homes has largely vanished.  It is now at its lowest level since the 1950s. This seems  more extreme when it is compared with the fact that the US population has more than doubled since then.

Fourth, while the US mortgage foreclosure rate remains high, the delinquency rate is slowing as are the number of new foreclosures, pointing  to a decline in foreclosures ahead.

Finally, housing affordability has reached a record level. While this has not been acted upon given the excess supply of housing and tough economic conditions, we are likely to see greater demand for houses as the excess supply dwindles and economic conditions improve.

Similarly, house price to income and house price to rent ratios have collapsed, pointing  to good value in US housing.

The improvement in US house price valuation measures stands in stark contrast to the still very overvalued Australian housing market…but that’s a different story. Note both the US and Australian charts use OECD data for consistency.

The bottom line is that the US housing market  appears to have bottomed with recovery in both activity and prices likely.

What a recovery in US housing would mean?

A recovery in US housing has several implications.

  • First, by reversing a significant drag on the US economy it should help perpetuate economic recovery.
  • Second, this is likely to be reinforced by a boost to US household weatlh as house prices stailise and recover.
  • Third, residential construction is a key user of raw materials like copper, therefore a recovery in US housing construction should boost global commodity demand.

Concluding  comments

While the secular bear market  in US shares that began 12 years ago may have further to go, there are a number of positives suggesting there is light at the end of the tunnel. In particular the US housing sector appears to be bottoming.  This is an important investment theme, but is difficult to play from Australia.  Magellan and Platinum Asset Management have their portfolios positioned with this information in mind.

Taken from an article written by Dr Shane Oliver, Head of Investment Strategy and Chief Economist - AMP

Important note: While every care has been taken in the preparation of this document, AMP Capital Investors Limited (ABN 59 001 777 591) (AFSL 232497)  makes no representation or warranty as to the accuracy or completeness of any statement in it including, without limitation, any forecasts. Past performance is not a reliable indicator  of future performance. This document has been prepared for the purpose of providing general  information, without taking account of any particular investor’s objectives, financial  situation or needs.  An investor should, before  making  any investment decisions,  consider the appropriateness of the information  in this document, and seek professional advice, having regard to the investor’s objectives, financial situation and needs. This document is solely for the use of the party to whom  it is provided.


Uncertain Housing Market

(Aust Financial Review 25th May 2011)

Australia’s housing market looks very expensive with prices running at around 25% higher than the long-term average.  Further gains will be limited by the high debt levels borrowers have taken on to buy property.

It means they are vulnerable if anything goes wrong.  With this in mind the veiled threats by the Reserve Bank of Australia to raise interest rates must send a shudder through some investors.

A recent run of soft consumer data shows that confidence levels are already low in most households, so any move by the RBA will hit hard.  According to AMP Capital Investors, so far this year prices are down 2%.

Australian Property Bubble?

(Aust Financial Review 26th May 2011)

According to the Organisation for Economic Co-operation and Development, the ratio of house prices to incomes is 34% above its long term average and the ratio of house prices to rents is 50% above its long term average, both being at the top end of OECD countries.

Also, the 2011 Demographia International Housing Affordability Survey shows that in Australia the median multiple of house prices to annual household income is double that of the US.

AMP economist Shane Oliver points out that in Los Angeles the median house price is $345,600 in Sydney it is $US$634,300.  In Austin, in oil rich Texas, the median price is $189,100, in Perth it is $480,000.


Value in Commercial Property – Office Market Summary

In the lead up to the Global Financial Crisis, we did not invest in Listed Property Trusts or Unlisted Property Trusts.

With the significant realignment in these property markets we now are seeing value of investing in Commercial Property markets.

This article focuses on the Office market within the Commercial Property sector.

2010 saw the following occur in the Office market:
• CBD Office vacancy rates peaked at 8.3% and are now trending down
• Capital values increased by around 5%
• There was tangible evidence of increased demand for space
• Prime Gross Effective Rents increased by 1.4%

When considering a commercial property investment we normally would recommend investors seek the following in a property investment trust vehicle:

- Vehicle should have High Quality Tenants of well known companies with strong brand names in a strong financial position. The property vehicle should not overly focus on one tenant.
- Consider the Average Lease Expiry (referred to as ALE) – this is the average term that tenants have to run before their lease is up for renegotiation. A longer ALE should result in a higher income certainty for the investment vehicle
- Level of Gearing – we would normally start to become uncomfortable with a property investment with more than 50% gearing
- Investment vehicle should contain a number of properties in different locations, rather than relying on either one area, or worse still one property.

IMPORTANT INFORMATION: Any advice contained in this article is general advice only and does not take into consideration the reader’s personal circumstances. Any reference to the reader’s actual circumstances is coincidental. To avoid making a decision not appropriate to you, the content should not be relied upon or act as a substitute for receiving financial advice suitable to your circumstances. When considering a financial product please consider the Product Disclosure Statement

Property - Is this the tipping point?

This article is reproduced with permission from Investsmart.


In this week's Property Point podcast with CoreLogic's Tim Lawless, home dwelling prices are patched into a deeper narrative, where everyday investors require expert guidance.

Welcome to Property Point, a podcast exploring all things related to property investment in Australia.

This week I’m speaking to Tim Lawless, Head of Research at CoreLogic Asia Pacific.

The CoreLogic home value index lost 0.5% in April. That’s after we saw a 0.7% fall in March, and a 0.9% fall in February.

Could this easing represent a turnaround to come?

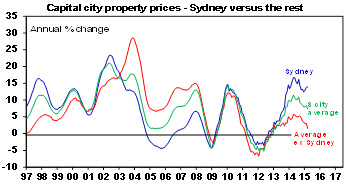
House price declines seem to have moderated in Sydney and Melbourne. However, there are signs of further price slippage elsewhere, outside of our two capitals.

Sydney has come off 10.9% for the year and Melbourne has come off 10%. Prices are back to mid-2016 levels in both cities, and about 20-25% off their levels seen five years ago in 2014.

From the September 2017 peak, national house prices are now down nearly 10%. 

Sydney and Melbourne read as much worse, down 14.5% and 10.9% from their peaks respectively. Melbourne’s price declines have now surpassed the 1989 downturn – in addition to 2004, 2008, 2010 and 2015's downturns.

The current price adjustment has now extended for 19 months.


Tim, this spot of data, being CoreLogic home values, finds itself in a very patchy narrative.  Home sales volumes are at 23-year low, which was another set of data that came out this week, even though auction clearance rates have been holding steadier, in some pockets ticking up over the last little while.  The big question, of course, in light of all of this, are you expecting further declines through the rest 2019 or have we seen the bottom?

Well, of course the market is very different from region to region.  But broadly, yes, we are expecting values to continue falling across most areas of Australia.  That's certainly been a most recent trend, although we aren't seeing values falling quite as quickly as what they were late last year or a bit earlier in 2019, it's quite clear that markets like Sydney and Melbourne are still seeing a fairly rapid rate of decline.  In fact, our April figures showed Sydney values were down by 0.7 of a percent over the month, and Melbourne's down 0.6%.  Not quite as bad as the nearly 2% month on month declines that we were seeing late last year, but still quite a material decline and we are also seeing the geographic scope of weakening conditions has expanded to include other capital cities, where values were generally rising previously.

And taking a broader view from that, so what are we seeing in terms of data standouts outside of Sydney and Melbourne?  Is the troubled Perth turning around, or is Hobart continuing its upswing?

Well, touching on Perth, no, unfortunately, we're still seeing values falling in Perth.  In fact, about a year and a half ago, we were seeing some signs that Perth was close to levelling out and values were holding relatively firm, but there has been a bit of a freshening of the downwards trend, which I think probably coincides with the tighter credit regime we're in at the moment as well as the fact that local economic conditions across WA still remain relatively soft.  I could say the same things about NT and Darwin, as well.

Interestingly enough, in Hobart, that really has been the standout market.  It's the market where values having been trending higher quite quickly, but our April figures have shown had a bit of a crack in that façade, with values falling by nearly 1% over the month in Hobart, which I guess doesn't really come as much of a surprise considering that the growth rates were highly unsustainable in that marketplace.  A bit more than a year ago values were rising at nearly at nearly 13% per annum, and now the annual rate of growth is just below 4% across Hobart and, of course, affordability constraints in that market have really deteriorated quite quickly.


Source: CoreLogic

Last year, I think most of the warnings were around apartments, particularly Melbourne and Brisbane.  But now it seems like, to me, that everyone might have been worried about the wrong thing, where houses have actually shown a bigger price correction over the last year and the cycle to date.  But is that just a function of the price run-up we saw in houses, as opposed to apartments?  Or is there something more to it?

I think there's a few things happening here, and just to explain the numbers, looking at some of the largest cities.  For example, we could write a pretty good case study, so Sydney house values over the past 12 months are down 11.8% and Sydney unit values are down by just over 9%, 9.1%.  With a really similar story in Melbourne.  So absolutely, unit values are falling, but not quite as much as what we've seen in the unit sector.  So, I think what's driving that trend is a couple of things; one would be that we are seeing the market becoming very price sensitive, and of course apartments do offer up a much lower price point than detached housing.  And the reason I think we are seeing this price sensitivity comes back to affordability issues in the most expensive markets.  But probably more importantly is, I suppose, the change in the credit environment, where we are seeing lenders generally becoming much more cautious around high debt to income ratios and debt to loan ratios, which seems to be funnelling credit demand and credit availability toward that middle to low end of the market.

I think also with the surge first home buyer activity, particularly across Sydney and Melbourne, of course that segment of the marketplace is very price sensitive and I think that there is an anecdotal trend at least, where we're seeing more and more of first home buyers are willing to sacrifice their backyard and Hill’s hoist, and look for areas or housing stock that may be medium to high density, but located closer to where they're working, or where their family is, or closer to major transport nodes and so forth.

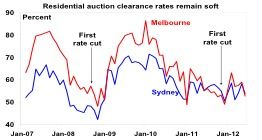
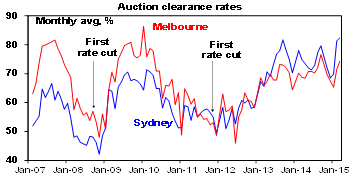
I'd like to just touch on clearance rates as well, which do remain at historically low levels.  Several are making predictions, like JPMorgan, that clearance rates will remain below 50% for most of 2019.  And elsewhere it’s been claimed that anything below 50% is a very weak result, and that it's evidence the market is still falling.  But I've noticed that markets like Brisbane are actually consistently below 50% for clearance rates.  So, what do you think about this?  Is 50% nationally actually a tipping point?  Or does it mean anything?

I think you can read a little bit too much into the national clearance rates.  And, generally speaking, clearance rates are very, I suppose, important, very indicative of market conditions.  In markets where auctions are still a very popular way of selling, and that's generally restricted to Melbourne, Sydney, and Canberra.  Most other markets see a very small proportion of properties being taken to auction and auction clearance rates are much less indicative of broader market conditions, probably more indicative of what's happening in the premium sector where you generally find unique properties or distressed properties are taken to auction. 

I think that when we look at auction clearance rates in say Sydney and Melbourne, to a lesser extent in Canberra, we're generally seeing the auction clearance rate holding around the mid to low 50% mark, which as you say is still very low.  It does suggest that there is ongoing weakness in the market, but they are much better than what we were seeing at the end of last year, where auction clearance rates were down around the low 40% mark, even at one stage dipping below 40% in Sydney.  I think that does coincide with this subtle improvement in the rate of decline that we've been seeing across Sydney and Melbourne over recent months.  The market's still falling, but not as quite as severe as what it was.  Auction clearance rates are still low, but not as quite as severe as what they were late last year.

Tim, looming large over property, of course, is the RBA, which is meeting next week.  The RBA has raised the issue of negative equity.  I'd like to ask you about this.  I don't know whether too much attention is paid to negative equity, like you've said with clearance rates, given the context where as long as a household with a mortgage has an income and a job, the RBA has said they don't seem to think it'll be a problem.  What's your view on the negative equity conundrum, where if house prices fall 25% nationally, I've read, it would put 850,000 home buyers in negative equity?

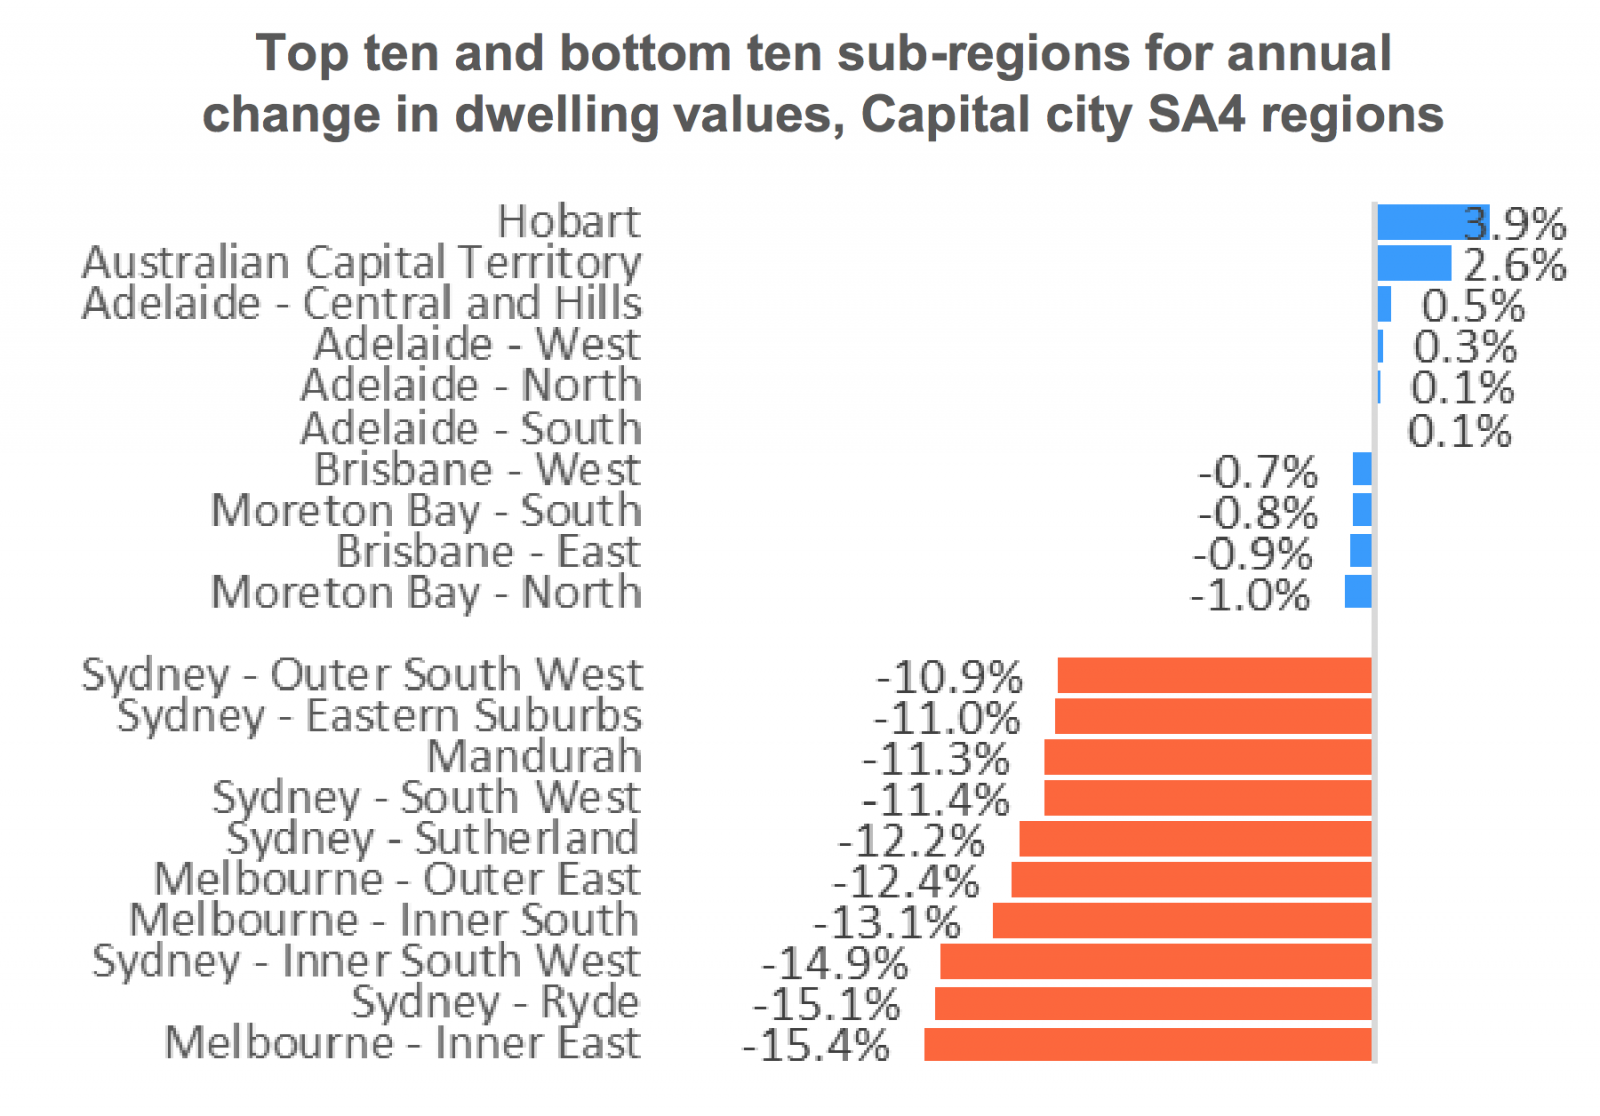
Yeah, that makes sense to me.  It's actually quite an elusive statistic to obtain in Australia.  Simply because there isn't a lot transparency or visibility on the debt side of individual home ownership.  Quite clearly, in our data we can see how much values have fallen, how much values have changed, but we don't know how much deposit, for example, was held against individual properties.  What we can see though that gives us a pretty firm hint around equity levels would be the areas around Australia where values have fallen by say more than 15 and more than 20%.  So if I look around the subregion of the capital cities, there's only one region across the country based on statistical area 4s, SA4 regions, where values have fallen by more than 20%, and that's the Sydney area of Ryde, where values are down by 22.7%.  You've also got areas like the inner south-west of Sydney, Sutherland Shire, the Hills District, the inner west and North Sydney, where values have fallen by more than 15%, and you could throw Parramatta in there as well.

In Melbourne, it would be the areas like the inner-east and the inner-south, which tend to be more exclusive markets, where values have fallen by more than 15%.  When you have value declines of that magnitude, it's pretty clear that if you're a recent buyer to the marketplace, and so you did have a 15% to 20% deposit, then there will be some evidence of negative equity creeping into those markets.


Source: CoreLogic

How likely, Tim, do you think a rate cut is next week by the RBA?  The market's pricing a 40% probability.

It's my view that we probably will see the RBA starting to position for a rate cut later this year, but probably not cut in the May meeting.  Simply because I think cutting before the federal election may be a thing a difficult thing to do politically, not that the RBA has political ties.  But also, the fact that I think the RBA probably will start changing their commentary to start setting up an expectation for a rate cut over coming months.  Of course, we did see the very low inflation numbers, in fact, you know, the donut after the March quarter, but we're still reasonably strong labour market indicators, mostly emanating out of New South Wales and Victoria, of course.  But I think that as we start to see labour markets potentially softening, as the residential construction sector in both those states starts to settle down, then maybe we might start to see more evidence of the labour market indicators, which is another key element of what the RBA is looking for before they cut, could start to soften out a little bit.

And another big question: Will rate cuts fire up housing again?  Do you think that will be the catalyst?

I'm not too sure about that.  Absolutely, if we do see rates coming down, and I think we probably will see rates move lower and then most of that being passed onto mortgage rates as well, but we still have a fairly substantial serviceability assessment as a barrier for a lot of borrowers.  I don't think, even if we do see mortgage rates moving lower, it won't have the same stimulatory effect as what we've seen over previous periods when rates have come down.  No doubt it's going to be a net positive for the marketplace, a lower cost of debt is always going to be positive, but I think there will be some prospective buyers out there who simply will still find that obtaining finance and getting through that credit assessment is going to be a barrier for a substantial or a mature enough lift in buying activity.

Do you expect that changes to negative gearing, should Labor get in at the federal level later this month, are they already factored into these changes in home prices?  Or do you think an even bigger slide could happen if Labor does get in?

Well it's certainly an uncertainty, and I think the truth is that nobody really knows what the effect of these policy changes might be if we do see a change in government and they do get through to the senate.  I think, generally speaking, if you remove an incentive from the marketplace, generally that's an overall net negative, and we'd expect there to be some dampening effect on investment activity in the market.  To what extent that impacts on prices is really the great unknown.  My expectation is if you take away some demand for the marketplace, it's likely to have some further downwards pressure on prices.  Maybe that could be compensated by some upwards pressure from lower mortgage rates, improved affordability, and so forth as well.  So overall, not too sure how that outcome's going to play out, but I think if we do see less investment of the marketplace, we potentially would see rental rates gradually starting to rise higher and I guess, encouraging that already evident trend where rental yields are moving higher, probably would result in higher rental yields longer term, alleviating the need for negative gearing in the first place.

I think the biggest question here is the adjustment period, if we do see these policies implemented, what's that adjustment period going to look like, and how much does it impact negatively on housing prices.

I might leave it at there for today with the great unknown.  Thank you so much Tim, for the chat.

Thanks, it’s been a good chat, great interview.  Thanks very much.

That was Tim Lawless, head of research at CoreLogic Asia Pacific.

Australian Property Bubble - are we at the bottom yet?

Roger Montgomery (Montgomery Investments) talks with Mark Draper (GEM Capital) about the Australian property market which is now firmly in decline.

They discuss whether the market has bottomed and what indicators investors should be watching out for as well as some investments to be cautious about.


The Australian Housing Market - bubbling away

Written by Shane Oliver - Chief Economist AMP

The cooling in the Sydney and Melbourne property markets evident in late 2015 in response to macro prudential tightening deployed by APRA has proved ephemeral. Price gains have reaccelerated and auction clearance rates & lending to property investors have rebounded. Over the last five years Sydney dwelling prices have risen a ridiculous 73% and Melbourne prices are up 47%. As a result the Australian housing market continues to cause much angst around poor affordability and high household debt. This note looks at the main issues.


Source: CoreLogic, AMP Capital

Is Australian housing overvalued?

On most measures Australian housing is overvalued:

  • On the basis of the ratio of house prices to rents adjusted for inflation relative to its long term average Australian houses are 39% overvalued and units 13% overvalued.
  • According to the 2017 Demographia Housing Affordability Survey the median multiple of house prices in cities over 1 million people to household income is 6.6 times in Australia versus 3.9 in the US and 4.5 in the UK. In Sydney it’s 12.2 times and Melbourne is 9.5 times.
  • The ratios of house prices to incomes and rents are at the high end of OECD countries.


Source: OECD, AMP Capital

Why is it so expensive and household debt so high?

There are two main drivers of the surge in Australian home prices over the last two decades. First, the shift from high to low interest rates has boosted borrowing and hence buying power. This has taken Australia’s household debt to income ratio from the low end of OECD countries 25 years ago to the top end. Second, there has been an inadequate supply response to demand. The following chart shows a cumulative shortfall relative to underlying demand had built up by 2014 and is still yet to be worked off despite record construction lately.


Source: ABS, AMP Capital

Consistent with this, while vacancy rates have increased they have only increased to around average long term levels. In Sydney vacancy rates are below average.

What about investors and foreign buyers?

A range of additional factors may be playing a role in accentuating demand beyond that implied by population growth. These include negative gearing and the capital gains tax discount, foreign buying and SMSF buying. Negative gearing is just part of the normal operation of the Australian tax system. However, the interaction with the capital gains tax discount by enhancing the after tax return available to property investment may be resulting in higher investment activity than would otherwise be the case. This may particularly be the case when past property price gains have been strong encouraging investors to think future gains will be too. While commitments to lend to property investors slowed in 2015 after APRA tightened macro prudential controls, this has since worn off.


Source: ABS, AMP Capital

Foreign buying is likely also impacting – with indications that it is around 10-15% of demand – but it is also concentrated in particular areas and SMSF buying appears to be relatively small. But like lower interest rates, all of these should have a less lasting impact if the supply response was stronger.

Is a crash likely?

The surge in prices and debt has led many to conclude a crash is imminent. But we have heard that lots of times over the last 10-15 years. In 2004, The Economist magazine described Australia as “America’s ugly sister” thanks in part to a “borrowing binge” and soaring property prices. Most recently the OECD has warned of the risks of a property crash. However, the situation is not so simple:

  • Firstly, we have not seen a generalised oversupply and at the current rate we won’t go into oversupply until 2018 and in any case approvals suggest supply will peak this year.
  • Secondly, mortgage stress is relatively low and debt interest payments relative to income are around 2003-04 levels.
  • Thirdly, lending standards have not deteriorated like they did in other countries prior to the GFC. In recent years there has been a reduction in loans with high loan to valuation ratios and interest only loans are down from their peak.
  • Finally, generalising is dangerous. While prices have surged in Sydney and Melbourne, they have fallen in Perth to 2007 levels and seen only moderate growth in other capitals.

To see a general property crash – say a 20% plus average price fall - we need to see one or more of the following: a recession - which looks unlikely; a surge in interest rates - but rate hikes are unlikely until 2018 and the RBA will take account of the greater sensitivity of households to higher rates; and property oversupply – this would require the current construction boom to continue for several years. However, the risks on the supply front are high in relation to apartments.

What can be done to fix it?

Recent RBA commentary strongly hints that more macro prudential measures to tighten lending standards are on the way. These could include a further lowering in the 10% growth cap on the stock of lending to investors and tougher debt serviceability tests. This is in part about reducing the risks to financial stability when it’s too early to consider raising rates.

More fundamentally, policies to help address poor housing affordability should focus on boosting new supply, particularly of standalone homes which have lagged. This includes relaxing land use restrictions, releasing land faster, speeding up approval processes and encouraging greater decentralisation. This is largely a state issue. Policies designed to make better use of the existing housing stock (eg, by relaxing constraints on empty nesters downsizing) could also help.

Policies that are unlikely to be successful include increased first home owner grants (as in periods of high demand they just result in higher prices) and allowing first home buyers to access to their super (again this will just result in even higher prices unless supply is fixed before and will mean less in retirement).

Tax reform should ideally be part of the package and include replacing stamp duty with land tax (again a state issue), removing the capital gains tax discount that is a distortion in the tax system and lower income tax rates to discourage use of negative gearing as a tax avoidance strategy. Piecemeal cuts to stamp duty targeted at FHBs will just result in higher home prices. Abolishing negative gearing would just inject another distortion in the tax system and could adversely affect supply (although I can see a case to cap excessive benefits).

What is the outlook?

Generalised price falls are unlikely until the RBA starts to raise interest rates again and this is unlikely until later in 2018, which after a few hikes will likely trigger a 5-10% pullback in property prices as was seen in the 2009 & 2011 cycles:

  • Sydney & Melbourne having seen big gains are most at risk.
  • Prices are likely to fall further in Perth and Darwin this year, but they are close to bottoming and should rise next year.
  • The other capitals are likely to see continued moderate growth this year and a less severe down cycle around 2019.
  • But units are at much greater risk given surging supply and this could see unit prices in parts of Sydney & Melbourne fall by 15-20% as investor interest fades as rents falls.

What are the risks to the economy?

Slowing momentum in building approvals points to a slowdown in the dwelling construction cycle ahead. This combined with a slowing wealth affect from rising home prices means that the contribution to growth from the housing will slow. However, as this is likely to coincide with a fading in the detraction from growth due to falling mining investment and higher commodity prices it’s unlikely to drive a slowing in the economy. However, a likely decline in rents (as the supply of units hits) will constraint inflation helping keep interest rates low for longer.


Source: REIA, AMP Capital

A property crash would have bigger impact given the exposure of banks, but as noted above such a development is unlikely.

Implications for investors


  • While there is a strong long term role for residential property in investors’ portfolios at present their remains a case for caution. It is expensive on all metrics and offers very low net income (rental) yields of 2% or less. This leaves investors highly dependent on capital growth.
  • But it is dangerous to generalise. Apartments in parts of Sydney and Melbourne are probably least attractive. Best to focus on areas that have lagged behind.
  • Finally, investors need to allow for the fact that they likely already have a high exposure to Australian housing. As a share of household wealth it’s nearly 60%.


Australian Housing in One Chart


We sourced this chart from our friends at the Montgomery Fund - it is self explanatory in our view.


We are recommending caution with investments that are leveraged to the housing market in Australia which would appear at extreme levels.

Australian House Prices - at the extreme

Key  points

> A  housing recovery has been a necessary aspect of rebalancing the economy through  the mining bust.

> While  Australian property prices are overvalued, this should not be a constraint on the  RBA. Expect another rate cut in May with the possibility of more to follow.

>The  medium term return outlook for residential property is likely to be  constrained.


Introduction

The case for the RBA resuming interest  rate cuts this year has been fairly clear: commodity prices have fallen more than  expected; the $A has remained relatively high; while residential construction  and consumer spending are okay the outlook for business investment has deteriorated pointing to overall growth remaining sub-par; and inflation is  low. This has seen the cash rate fall to 2.25%. While the RBA left rates on  hold at its April meeting, it retains an easing bias pointing to further cuts  ahead.

However, the main argument against further  rate cuts has been that the housing market is too hot and further rate cuts risk pushing home prices to more unsustainable levels resulting in a more damaging  eventual collapse. But how real is this concern? 

Housing construction doing its part…

Economic upswings in Australia rarely start without a housing upswing. Lower  interest rates drive housing demand resulting in higher house prices which  boosts consumer spending via wealth effects and drives home building. The  latter is happening with approvals to build new homes at record levels.


  Source:  Bloomberg, AMP Capital 

…but what about overheated property  prices?

But the big debate has been whether low rates are  just fuelling an overheated property market. Its long been known that Australian housing is expensive and overvalued. 

      
      Real house prices have been running well above trend  since the early 1990s and are now 14% above it.  

  Source:  ABS, AMP Capital 

      
      According to the 2015  Demographia Housing Affordability Survey the median multiple of house prices to  household income in Australia is 6.4 times versus 3.6 in the US and 4.7 in the  UK. In Sydney its 9.8 and 8.7 in Melbourne.
      
      The ratios of house  prices to incomes and to rents are at the high end of comparable countries in  the OECD. 

While it's generally agreed Australian property  prices are high, the reasons for it are subject to much debate with many looking for scapegoats in the form of negative gearing and buying by foreigners  and SMSF funds. However, these don't really stack up: negative gearing has been around for a long time and while foreign and SMSF buying has played a role it  looks to be small and foreign buying is concentrated in certain areas. 

The shift to low interest rates since the early  1990s has clearly played a role. Consistent with this, the rise in price levels  from below to above trend has gone hand in hand with increased household debt.  The trouble is that other countries have lower levels of interest rates and  most have lower household debt to income ratios and house price to income  ratios. A more fundamental factor is constrained supply. Vacancy rates remain low and there has been a cumulative supply shortfall since 2001 of more than 200,000  dwellings. The main reason behind the slow supply response appears to be tough  land use regulations in Australia compared to other countries.

High house prices compared to rents and incomes  combined with relatively high household debt to income ratios suggest Australia  is vulnerable on this front should something threaten the ability of households  to service their mortgages. While this vulnerability has been around since the  house price boom that ran into 2003 – with numerous failed predictions of  property crashes! – the RBA is right to be concerned not to further inflate the property market. The renewed strength in auction clearance rates this year to record  levels in Sydney is a concern. 


  Source: Australian Property Monitors, AMP Capital 

However,  there are some offsetting factors. First, home price gains are now narrowly  focussed on Sydney. According to CoreLogic RP Data Sydney home prices rose  13.9% over the year to March. But growth across the other capital cities ranged  from 5.6% in Melbourne to -0.8% in Darwin with an average of just 1.5%. So, the  rest of the Australia is hardly strong. 


  Source: CoreLogic RP Data, AMP Capital

Second, growth  in housing debt is running well below the pace seen last decade, and there are some signs of a loss of momentum in the last few months.Investor debt is up  10.1% year on year but reached around 30% through 2003 and in the last few months has slowed to an annualised pace of 9.3%. 


  Source: RBA, AMP Capital

Finally, the RBA and APRA have pushed down the macro prudential path to contain risks around housing.Tougher APRA expectations of  banks were announced in December with the threat of sanctions if these expectations are not met.

So while the RBA is right to be mindful of the  impact of low interest rates on the property market, the concentration of the  property market strength in just Sydney, the signs of a possible topping in investor property loan growth and the heightened role of APRA indicates that  the property market should not be a constraint on further RBA interest rate  cuts. As the RBA has pointed out in the past it needs to set interest rates for  the "average" of the economy. And the "average"still points to the need  for lower interest rates as the slump in mining investment intensifies, non-mining investment remains weak, iron ore prices are down another 23% since  the February RBA cut, the outlook remains for sub trend growth and ongoing spare  capacity in the economy and inflation remains benign. This points to the need  for further rate cuts to provide a direct boost to spending and an indirect  boost via the inducement to a lower Australian dollar. Expect the cash rate to  fall to 2% in May with a strong possibility rates will fall below that later  this year.  

Housing as an investment

Over the very long term residential property adjusted for costs has provided a similar return for investors as Australian shares. Since the 1920s housing has returned 11.1%  pa compared to 11.5% pa from shares. See the next chart. 


  Source: ABS, REIA, Global Financial Data, AMP Capital  Investors

They also  offer complimentary characteristics: shares are highly liquid and easy to diversify but more volatile whereas property is illiquid but less volatile. And share and property returns tend to have low correlations with each other so  including both offers diversification benefits. As a result there is a case for  investors to have both in their portfolios over the long term. 

In the short  term, low interest rates point to further gains in home prices. However, this is likely to be constrained by the economic environment and the impact of  tougher prudential scrutiny of bank lending by APRA. Over the next 12 months  home price gains are likely to average around 5%, maybe a bit stronger in  Sydney and Melbourne (key beneficiaries of the post mining boom rebalancing) but staying negative in Perth and Darwin (as the mining bust continues). 

The residential property outlook for the next 5-10 years though is messy. Housing is expensive on all metrics and offers very low rental yields compared to all other assets except bank deposits and Government bonds. The gross rental yield on housing is around 2.9% (after costs this is around 1%), compared to yields of 6% on commercial property and 5.7% for Australian shares  (with franking credits). See the next chart. 


  Source: Bloomberg, REIA, AMP Capital

This means that the income flow an investment in housing generates is very low compared to shares and commercial property so a housing investor is more dependent on capital growth to generate a decent return. So for an investor, these other  assets continue to represent better value.

Dr Shane Oliver 
Head of Investment Strategy and Chief Economist 
AMP Capital

- See more at: http://media.amp.com.au/phoenix.zhtml?c=219073&p=irol-oliverArticle&ID=2033356#.dpuf

Australian Housing .... still expensive

In the long running obession that Australians have for the property market, we have sourced the latest affordability charts that outline housing affordability in Australia (a key measure of price), relative to other countries property markets.  The key measure used is the price of property relative to income.  The higher the multiple of income, the higher the price.

The first chart shows that Australia's property market is far more attractive than Hong Kong and even New Zealand.  Measured against Canada, a country that has many similarities to Australia, our market looks stretched.

To put this chart though into more perspective, let's consider what sort of levels are considered unaffordable.  Here is a table showing broadly accepted definitions.

Finally the table below shows the numbers on a "State by State" basis.


"Hong Kong's Median Multiple of 17.0 was the highest recorded (least affordable) in the 11 years of the Demographia International Housing Affordability Survey. Again, Vancouver was second only to Hong Kong, with a Median Multiple of 10.6. Housing affordability in Sydney deteriorated to a Median Multiple of 9.8, which was followed by San Francisco and San Jose (each 9.2). Melbourne had a Median Multiple of 8.7 and London (Greater London Authority) 8.5. Three other markets had Median Multiples of 8.0 or above, including San Diego (8.3), Auckland (8.2) and Los Angeles (8.0)."

Jeremy Grantham, a world recognised investor with GMO remains concerned at the levels of the Australian property market and we would encourgage investors to exercise caution in assuming the run up in property prices will be a permanent feature of the Australian economy.


Note:  Charts sourced from Mike Shedlock "Mish's Financial Trend Analysis"


This information is of a general nature only and neither represents nor is intended to be personal advice on any particular matter. We strongly suggest that no person should act specifically on the basis of the information contained herein, but should obtain appropriate professional advice based upon their own personal circumstances including personal financial advice from a licensed financial adviser and legal advice. Fortnum Private Wealth Pty Ltd ABN 54 139 889 535 AFSL 357306


Australian House Prices - Bubble Trouble?

We do not wish to join the queue of forecasters calling an Australian house price bubble, but we did think it worthwhile to flag this graph that appeared in a recent Financial Review article.

The chart below tracks median house prices in several western countries since 1995.  Clearly the red line, which is Australia shows the highest rate of growth in house prices since 1995 from the countries selected, with Canada coming in second.

Canada of course joins Australia as an exporter of raw materials to China, and in many ways is considered a very similar economy to ours.

The next chart shows the house price growth per state in Australia from the Reserve Bank.

This graph shows sharp price increases particularly in the eastern states (left side of graph), with more subdued price action in Adelaide and Canberra.

Finally we consider the state of Household Finances, particularly the level of debt in the household sector.  The graph below clearly shows that following the GFC, households have not really reduced their debt levels, from an elevated level - they have simply slowed down their rate of borrowing.


The level of household debt in Australia is very high by world standards and we continue to remain cautious on investing into sectors that revolve around discretionary consumer spending as a result.  This is evident in the graph below (sourced from JP Morgan)

Australian house prices are considered to be the second most expensive in the world.  While we are not calling for a property crash, which would be in no-ones interest, we are suggesting caution for property buyers given that Australian houses are significantly more expensive than their US counterparts, and Australians have taken on more debt than many of our overseas peers.


This information is of a general nature only and neither represents nor is intended to be personal advice on any particular matter. We strongly suggest that no person should act specifically on the basis of the information contained herein, but should obtain appropriate professional advice based upon their own personal circumstances including personal financial advice from a licensed financial adviser and legal advice. Fortnum Private Wealth Pty Ltd ABN 54 139 889 535 AFSL 357306


Australian Property Market in Graphs

Debating the state of the Australian Residential Property market is a national past-time, so with that in mind we will contribute to the debate.  This article shows the Australian Residential Property market in a series of charts that compares our market to either historical averages, or other property markets around the world.


The chart above shows the price of property compared to average income for the last 100 years.  Clearly, current pricing is at an all time high relative to incomes.


This chart shows the house prices compared to rent received, measured as a deviation from the long term average.


The third graph shows House Price to Incomes, and measured on the basis of deviation from the long term average.


Finally, the chart below shows in blue the value of the median house price in Australia.  The Black line shows the median house price in 1986 if it were simply indexed to wages growth.  This chart confirms the disconnect between house prices inflation and wages growth.  Clearly houses have risen far more significantly than wages since 1986.


We recently asked well known Australian investor Roger Montgomery for his thoughts on the Australian property market - here is a short video with his thoughts.