Key points
After doubling in value against the $US over the last decade, the best is likely behind for the Australian dollar.
The commodity price boom is starting to fade in response to a moderation in Chinese growth as commodity supply starts to increase, the impact of quantitative easing in the US is being blunted by rate cuts in Australia with the prospect of more to come and the rise in the $A has exposed the high cost base of the Australian economy.
While further gains are likely in the value of the $A against the Yen (to around ¥110 by year end), the $A is likely to remain range bound this year against the $US with the risks on the downside, particularly over the next few years.
For Australian based investors, this means less need to hedge global exposures back to Australian dollars.
Introduction
The last decade saw a huge surge in commodity prices on the back of rapid growth in demand, as China industrialised, and as the supply of commodities was constrained. This hugely benefitted assets geared to commodity prices including emerging market shares in South America, resources companies and of course the Australian dollar which were all star performers.
For the $A it meant a rise from a low in 2001 of $US0.48 to a high in 2011 of $US1.10 and a 70% gain on a trade weighted basis. However, since 2011 the outlook for the Australian dollar has become more confused: commodity prices are high but have been sliding recently; monetary easing (particularly money printing) in the US and Japan is positive for the $A but has been blunted slightly by rate cuts in Australia and the chance of more to come; safe haven flows from central banks looking to diversify have helped support the $A but I get the feeling that they are late to the party and some would question Australia’s safe haven status; and the damage to Australia’s international competitiveness has become more evident.
Purchasing power parity
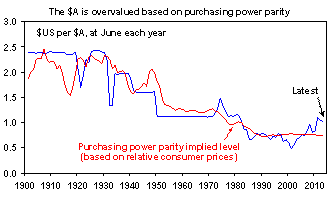
One of most common ways to value a currency is to compare relative prices. According to purchasing power parity theory, exchange rates should equilibrate the price of a basket of goods and services across countries, such that 100 Australian dollars would buy the same basket of goods in other countries as it does in Australia when translated into their currencies. A rough guide to this is shown in the chart below which shows the $A/$US rate against where it would be if the rate had moved to equilibrate relative consumer price levels between the US and Australia over the last 110 years or so.

Source: RBA, ABS, AMP Capital
Quite clearly purchasing power parity doesn’t work for extended periods with huge divergences evident at various points in time when the $A was fixed such as in the 1950s and 1960s and/or when other factors come into play. In fact, the $A as has gone from being dramatically undervalued in 2001 to similarly overvalued now on this measure now. However, it does provide a guide to where exchange rates are headed over very long periods of time. Such an approach has been popularised over many years by The Economist magazine’s Big Mac index.
An obvious problem with such measures is that they can give different results depending on the estimation period and the types of prices used. The relative consumer price measures used in the chart above would suggest that the $A is currently around 35% overvalued, whereas according to the Big Mac index it is only about 12% overvalued.
However, the broad impression is that the $A is overvalued on a purchasing power parity basis. This is consistent with current perception and news stories recently appearing about how Australia has gone from being a relatively cheap country a decade ago when the $A was much lower to an expensive country today. This suggests the $A could face downward pressure if some of the factors that have been holding it up reverse.
The major factors on this front are commodity prices, relative monetary policies and perceptions of Australia as a safe haven.
Commodity price boom starts to fray
Over the last forty odd years swings in commodity prices have been perhaps the main driver of the big picture swings in the $A. Rising commodity prices helped the $A into the mid 1970s, falling commodities correlated with a fall in the $A until around 2000 and over the last decade rising commodity prices explained the huge surge in the $A. The logic behind this is simple. 70% or so of Australia’s exports are commodities and moves in commodity prices are key drivers of our export earnings. However, the commodity price story is starting to fray at the edges. The pattern for raw material prices over the past century or so has seen roughly a 10 year secular or long term upswing followed by a 10 to 20 year secular bear market, which can sometimes just be a move to the side.

Source: Global Financial Data, Bloomberg, AMP Capital
The upswing is normally driven by a surge in global demand for commodities after a period of mining underinvestment. The downswings come when the pace of demand slows but the supply of commodities picks up in lagged response to the price upswing. After a 12 year bull run since 2000 this pattern would suggest that the commodity price boom may be at or near its end. Specifically, growth in China remains strong but it has slowed a bit (from 10% plus growth to 7 to 8% growth) just at the time when the supply of commodities is about to surge after record levels of mining investment globally. And a basing in the $US is also not helping: the falling $US helped boost commodity prices from around 2002 as they tend to be priced in US dollars. Now with the $US looking a bit stronger this affect is fading.
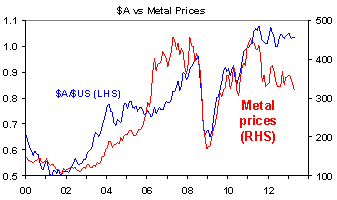
The chart below shows an index of prices for industrial metals such as copper, zinc, lead, etc, against the $A and suggest that they have gone from a positive influence, leading on the way up last decade, to potentially a negative.
Source: Bloomberg, AMP Capital
Relative monetary policies
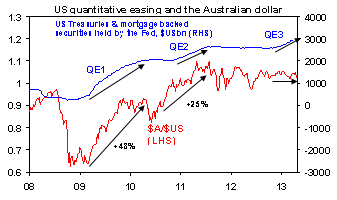
Quantitative easing in the US, Japan and elsewhere should be positive for the $A as it means an increase in the supply of US dollars, Yen, etc, relative to the supply of Australian dollars. And indeed it has been. Various rounds of QE in the US have been associated with $A strengthening, and the heightened efforts by Japan on this front only add to this pressure and have helped to push the $A up 25% over the last six months and the trade weighted value for the Australian dollar up to its highest since early 1985. Our assessment remains that as the value of the Yen continues to fall in response to aggressive monetary stimulus from the Bank of Japan, the $A will see further gains against the Yen, taking it to around ¥110 by year end.
However, against the $US the impact of quantitative easing may be starting to wain a bit. As can be seen in the chart below, while the first two rounds of quantitative easing in the US were associated with strong gains in the value of the Australian dollar, QE3 has just seen the $A continue to track sideways in the same $US1.02 to $US1.06 range it has been in since last July.
Source: Bloomberg, AMP Capital
This may be partly because QE3 has not seen a rise in commodity prices. But the main reason that the impact of quantitative easing may be starting to wain for the $A is that the interest rate differential in favour of Australia has fallen dramatically as the RBA has cut rates. With the Australian economy still struggling this may have further to go.
What about central bank buying and safe haven demand?
Buying by central banks looking to diversify their foreign exchange reserves and by investors allocating to a diminishing pool of safe AAA rated countries has no doubt played a role in boosting the $A. However, one can’t help but think that after a decade long bull market in the $A (or bear market in the $US) central banks are late to the $A party. And with the fading of the mining boom and the Government struggling to bring the budget back into surplus it has to be recognised that Australia is not without risk. So my feeling is that this source of support for the $A will start to fade.
Implications for investors
The bottom line is the best has likely been seen for the $A and the risks are on the downside over the years ahead as the commodity price boom fades, allowing the $A to correct some of its overvaluation on a purchasing power parity basis.
Currency is very important for investors as soon as they invest in foreign countries. Most global investments offered by fund managers come with a choice of being unhedged, ie exposed to fluctuations in the value of foreign currencies, or hedged, where the value of the investment is locked back into Australian dollars.
Over the last decade unhedged international shares returned 2.7% pa whereas hedged international shares gained 9.5% pa. The difference largely reflects the rise in the $A (+4.4% pa), but also the interest rate differential between Australia and the rest of the world (+2.4% pa). But if the $A is likely to go sideways or down there is much less need to hedge and with the interest rate gap between Australia and the rest of the world narrowing there is much less incentive to hedge.
In other words the reward versus risk equation in favour of the $A is diminishing so it makes more sense for investors now to consider taking an exposure to foreign currencies (ideally with the exception of the Yen) beyond the Australian dollar and obtaining the diversification benefits they provide.
Dr Shane Oliver
Head of Investment Strategy and Chief Economist
AMP Capital
This material has been provided for general information purposes and must not be construed as investment advice. This material has been prepared without taking into account the investment objectives, financial situation or particular needs of any particular person. Investors should consider obtaining professional investment advice tailored to their specific circumstances prior to making any investment decisions and should read the relevant Product Disclosure Statement.
